
 Yahoo Finance
 Do You Know What Collectors Universe Inc’s (NASDAQ:CLCT) P/E Ratio Means?

The goal of this article is to teach you how to use price to earnings ratios (P/E ratios). We’ll show how you can use Collectors Universe Inc’s (NASDAQ:CLCT) P/E ratio to inform your assessment of the investment opportunity. Collectors Universe has a price to earnings ratio of 27.06, based on the last twelve months. In other words, at today’s prices, investors are paying $27.06 for every $1 in prior year profit.
See our latest analysis for Collectors Universe
How Do You Calculate A P/E Ratio?
The formula for price to earnings is:
Price to Earnings Ratio = Share Price ÷ Earnings per Share (EPS)
Or for Collectors Universe:
P/E of 27.06 = $14.31 ÷ $0.53 (Based on the year to September 2018.)
Is A High Price-to-Earnings Ratio Good?
A higher P/E ratio implies that investors pay a higher price for the earning power of the business. That isn’t necessarily good or bad, but a high P/E implies relatively high expectations of what a company can achieve in the future.
How Growth Rates Impact P/E Ratios
When earnings fall, the ‘E’ decreases, over time. That means unless the share price falls, the P/E will increase in a few years. A higher P/E should indicate the stock is expensive relative to others — and that may encourage shareholders to sell.
Collectors Universe’s earnings per share fell by 57% in the last twelve months. And EPS is down 1.5% a year, over the last 5 years. This could justify a pessimistic P/E.
How Does Collectors Universe’s P/E Ratio Compare To Its Peers?
The P/E ratio indicates whether the market has higher or lower expectations of a company. The image below shows that Collectors Universe has a lower P/E than the average (30.1) P/E for companies in the consumer services industry.
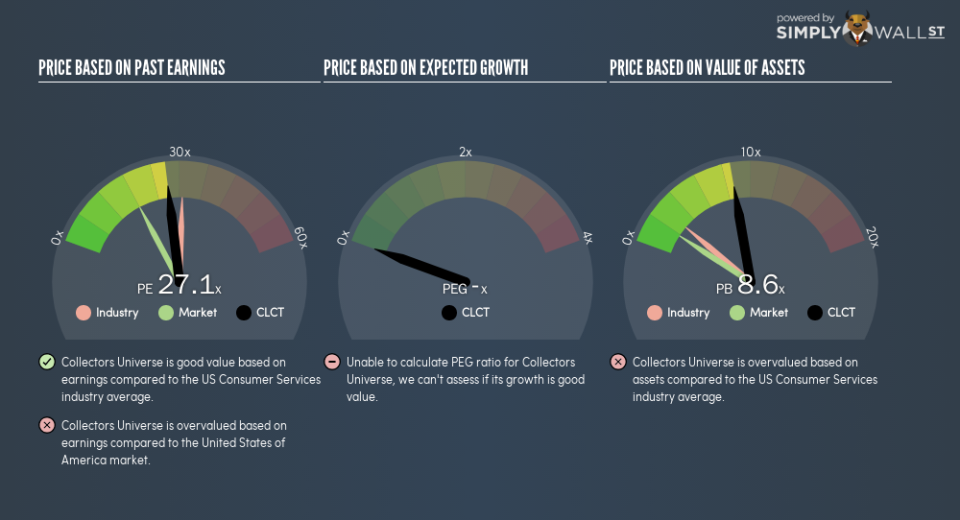
This suggests that market participants think Collectors Universe will underperform other companies in its industry. Many investors like to buy stocks when the market is pessimistic about their prospects. It is arguably worth checking if insiders are buying shares, because that might imply they believe the stock is undervalued.
Remember: P/E Ratios Don’t Consider The Balance Sheet
Don’t forget that the P/E ratio considers market capitalization. In other words, it does not consider any debt or cash that the company may have on the balance sheet. Theoretically, a business can improve its earnings (and produce a lower P/E in the future), by taking on debt (or spending its remaining cash).
Such spending might be good or bad, overall, but the key point here is that you need to look at debt to understand the P/E ratio in context.
Is Debt Impacting Collectors Universe’s P/E?
Collectors Universe has net cash of US$9.2m. That should lead to a higher P/E than if it did have debt, because its strong balance sheets gives it more options.
The Bottom Line On Collectors Universe’s P/E Ratio
Collectors Universe trades on a P/E ratio of 27.1, which is above the US market average of 17.9. Falling earnings per share is probably keeping traditional value investors away, but the net cash position means the company has time to improve: and the high P/E suggests the market thinks it will.
When the market is wrong about a stock, it gives savvy investors an opportunity. If the reality for a company is better than it expects, you can make money by buying and holding for the long term. Although we don’t have analyst forecasts, you could get a better understanding of its growth by checking out this more detailed historical graph of earnings, revenue and cash flow.
Of course you might be able to find a better stock than Collectors Universe. So you may wish to see this free collection of other companies that have grown earnings strongly.
To help readers see past the short term volatility of the financial market, we aim to bring you a long-term focused research analysis purely driven by fundamental data. Note that our analysis does not factor in the latest price-sensitive company announcements.
The author is an independent contributor and at the time of publication had no position in the stocks mentioned. For errors that warrant correction please contact the editor at editorial-team@simplywallst.com.
