
 Yahoo Finance
 Are Kip McGrath Education Centres Limited's (ASX:KME) Mixed Financials The Reason For Its Gloomy Performance on The Stock Market?
Kip McGrath Education Centres (ASX:KME) has had a rough three months with its share price down 25%. We, however decided to study the company's financials to determine if they have got anything to do with the price decline. Fundamentals usually dictate market outcomes so it makes sense to study the company's financials. Particularly, we will be paying attention to Kip McGrath Education Centres' ROE today.
Return on Equity or ROE is a test of how effectively a company is growing its value and managing investors’ money. Simply put, it is used to assess the profitability of a company in relation to its equity capital.
See our latest analysis for Kip McGrath Education Centres
How To Calculate Return On Equity?
ROE can be calculated by using the formula:
Return on Equity = Net Profit (from continuing operations) ÷ Shareholders' Equity
So, based on the above formula, the ROE for Kip McGrath Education Centres is:
8.3% = AU$1.9m ÷ AU$23m (Based on the trailing twelve months to June 2023).
The 'return' is the amount earned after tax over the last twelve months. So, this means that for every A$1 of its shareholder's investments, the company generates a profit of A$0.08.
What Is The Relationship Between ROE And Earnings Growth?
We have already established that ROE serves as an efficient profit-generating gauge for a company's future earnings. We now need to evaluate how much profit the company reinvests or "retains" for future growth which then gives us an idea about the growth potential of the company. Assuming all else is equal, companies that have both a higher return on equity and higher profit retention are usually the ones that have a higher growth rate when compared to companies that don't have the same features.
A Side By Side comparison of Kip McGrath Education Centres' Earnings Growth And 8.3% ROE
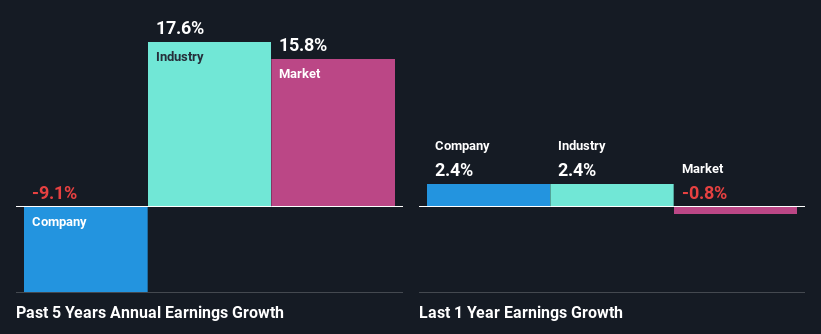
On the face of it, Kip McGrath Education Centres' ROE is not much to talk about. However, the fact that the its ROE is quite higher to the industry average of 4.9% doesn't go unnoticed by us. However, Kip McGrath Education Centres' five year net income decline rate was 9.1%. Bear in mind, the company does have a slightly low ROE. It is just that the industry ROE is lower. Therefore, the decline in earnings could also be the result of this.
However, when we compared Kip McGrath Education Centres' growth with the industry we found that while the company's earnings have been shrinking, the industry has seen an earnings growth of 18% in the same period. This is quite worrisome.
Earnings growth is a huge factor in stock valuation. What investors need to determine next is if the expected earnings growth, or the lack of it, is already built into the share price. This then helps them determine if the stock is placed for a bright or bleak future. Has the market priced in the future outlook for KME? You can find out in our latest intrinsic value infographic research report
Is Kip McGrath Education Centres Using Its Retained Earnings Effectively?
With a high three-year median payout ratio of 63% (implying that 37% of the profits are retained), most of Kip McGrath Education Centres' profits are being paid to shareholders, which explains the company's shrinking earnings. With only a little being reinvested into the business, earnings growth would obviously be low or non-existent. To know the 3 risks we have identified for Kip McGrath Education Centres visit our risks dashboard for free.
Additionally, Kip McGrath Education Centres has paid dividends over a period of nine years, which means that the company's management is rather focused on keeping up its dividend payments, regardless of the shrinking earnings.
Summary
On the whole, we feel that the performance shown by Kip McGrath Education Centres can be open to many interpretations. Specifically, the low earnings growth is a bit concerning, especially given that the company has a respectable rate of return. Investors may have benefitted, had the company been reinvesting more of its earnings. As discussed earlier, the company is retaining a small portion of its profits. Up till now, we've only made a short study of the company's growth data. So it may be worth checking this free detailed graph of Kip McGrath Education Centres' past earnings, as well as revenue and cash flows to get a deeper insight into the company's performance.
Have feedback on this article? Concerned about the content? Get in touch with us directly. Alternatively, email editorial-team (at) simplywallst.com.
This article by Simply Wall St is general in nature. We provide commentary based on historical data and analyst forecasts only using an unbiased methodology and our articles are not intended to be financial advice. It does not constitute a recommendation to buy or sell any stock, and does not take account of your objectives, or your financial situation. We aim to bring you long-term focused analysis driven by fundamental data. Note that our analysis may not factor in the latest price-sensitive company announcements or qualitative material. Simply Wall St has no position in any stocks mentioned.
