
 Yahoo Finance
 Is Kingsgate Consolidated Limited (ASX:KCN) A Financially Sound Company?

Kingsgate Consolidated Limited (ASX:KCN) is a small-cap stock with a market capitalization of AU$66.74M. While investors primarily focus on the growth potential and competitive landscape of the small-cap companies, they end up ignoring a key aspect, which could be the biggest threat to its existence: its financial health. Why is it important? Since KCN is loss-making right now, it’s vital to assess the current state of its operations and pathway to profitability. I believe these basic checks tell most of the story you need to know. However, given that I have not delve into the company-specifics, I’d encourage you to dig deeper yourself into KCN here.
Does KCN generate an acceptable amount of cash through operations?
KCN has shrunken its total debt levels in the last twelve months, from AU$98.10M to AU$11.57M , which comprises of short- and long-term debt. With this reduction in debt, KCN’s cash and short-term investments stands at AU$22.01M , ready to deploy into the business. Additionally, KCN has generated cash from operations of AU$56.95M over the same time period, resulting in an operating cash to total debt ratio of 492.20%, indicating that KCN’s operating cash is sufficient to cover its debt. This ratio can also be a sign of operational efficiency for unprofitable businesses as traditional metrics such as return on asset (ROA) requires positive earnings. In KCN’s case, it is able to generate 4.92x cash from its debt capital.
Can KCN meet its short-term obligations with the cash in hand?
At the current liabilities level of AU$5.35M liabilities, it seems that the business has maintained a safe level of current assets to meet its obligations, with the current ratio last standing at 5.34x. However, anything above 3x is considered high and could mean that KCN has too much idle capital in low-earning investments.
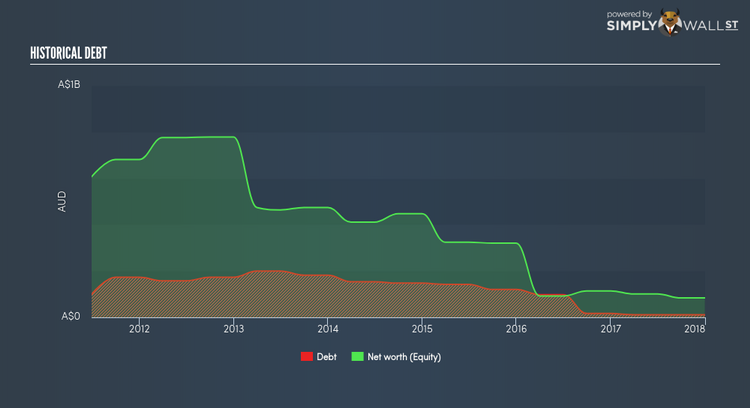
Does KCN face the risk of succumbing to its debt-load?
With debt at 13.61% of equity, KCN may be thought of as appropriately levered. KCN is not taking on too much debt commitment, which may be constraining for future growth. Risk around debt is very low for KCN, and the company also has the ability and headroom to increase debt if needed going forward.
Next Steps:
KCN has demonstrated its ability to generate sufficient levels of cash flow, while its debt hovers at a safe level. In addition to this, the company exhibits proper management of current assets and upcoming liabilities. I admit this is a fairly basic analysis for KCN’s financial health. Other important fundamentals need to be considered alongside. I suggest you continue to research Kingsgate Consolidated to get a more holistic view of the stock by looking at:
Valuation: What is KCN worth today? Is the stock undervalued, even when its growth outlook is factored into its intrinsic value? The intrinsic value infographic in our free research report helps visualize whether KCN is currently mispriced by the market.
Historical Performance: What has KCN’s returns been like over the past? Go into more detail in the past track record analysis and take a look at the free visual representations of our analysis for more clarity.
Other High-Performing Stocks: Are there other stocks that provide better prospects with proven track records? Explore our free list of these great stocks here.
To help readers see pass the short term volatility of the financial market, we aim to bring you a long-term focused research analysis purely driven by fundamental data. Note that our analysis does not factor in the latest price sensitive company announcements.
The author is an independent contributor and at the time of publication had no position in the stocks mentioned.
