
 Yahoo Finance
 What Kind Of Shareholders Own NIKE, Inc. (NYSE:NKE)?

A look at the shareholders of NIKE, Inc. (NYSE:NKE) can tell us which group is most powerful. Large companies usually have institutions as shareholders, and we usually see insiders owning shares in smaller companies. I quite like to see at least a little bit of insider ownership. As Charlie Munger said 'Show me the incentive and I will show you the outcome.
NIKE is a pretty big company. It has a market capitalization of US$145b. Normally institutions would own a significant portion of a company this size. Our analysis of the ownership of the company, below, shows that institutions are noticeable on the share registry. Let's take a closer look to see what the different types of shareholder can tell us about NKE.
Check out our latest analysis for NIKE
What Does The Institutional Ownership Tell Us About NIKE?
Institutional investors commonly compare their own returns to the returns of a commonly followed index. So they generally do consider buying larger companies that are included in the relevant benchmark index.
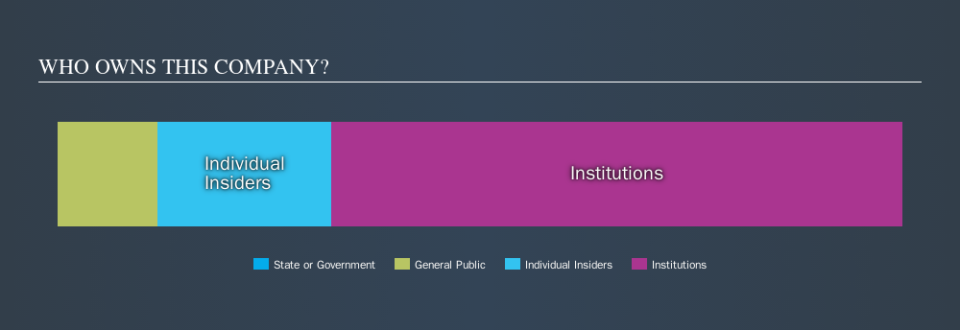
As you can see, institutional investors own 67% of NIKE. This implies the analysts working for those institutions have looked at the stock and they like it. But just like anyone else, they could be wrong. When multiple institutions own a stock, there's always a risk that they are in a 'crowded trade'. When such a trade goes wrong, multiple parties may compete to sell stock fast. This risk is higher in a company without a history of growth. You can see NIKE's historic earnings and revenue, below, but keep in mind there's always more to the story.

Institutional investors own over 50% of the company, so together than can probably strongly influence board decisions. We note that hedge funds don't have a meaningful investment in NIKE. Quite a few analysts cover the stock, so you could look into forecast growth quite easily.
Insider Ownership Of NIKE
While the precise definition of an insider can be subjective, almost everyone considers board members to be insiders. The company management answer to the board; and the latter should represent the interests of shareholders. Notably, sometimes top-level managers are on the board, themselves.
Most consider insider ownership a positive because it can indicate the board is well aligned with other shareholders. However, on some occasions too much power is concentrated within this group.
Our most recent data indicates that insiders own a reasonable proportion of NIKE, Inc.. It has a market capitalization of just US$145b, and insiders have US$30b worth of shares in their own names. That's quite significant. It is good to see this level of investment. You can check here to see if those insiders have been buying recently.
General Public Ownership
The general public holds a 12% stake in NKE. While this size of ownership may not be enough to sway a policy decision in their favour, they can still make a collective impact on company policies.
Next Steps:
I find it very interesting to look at who exactly owns a company. But to truly gain insight, we need to consider other information, too.
I like to dive deeper into how a company has performed in the past. You can access this interactive graph of past earnings, revenue and cash flow, for free.
But ultimately it is the future, not the past, that will determine how well the owners of this business will do. Therefore we think it advisable to take a look at this free report showing whether analysts are predicting a brighter future.
NB: Figures in this article are calculated using data from the last twelve months, which refer to the 12-month period ending on the last date of the month the financial statement is dated. This may not be consistent with full year annual report figures.
We aim to bring you long-term focused research analysis driven by fundamental data. Note that our analysis may not factor in the latest price-sensitive company announcements or qualitative material.
If you spot an error that warrants correction, please contact the editor at editorial-team@simplywallst.com. This article by Simply Wall St is general in nature. It does not constitute a recommendation to buy or sell any stock, and does not take account of your objectives, or your financial situation. Simply Wall St has no position in the stocks mentioned. Thank you for reading.
