
 Yahoo Finance
 What Kind Of Shareholders Own K Wah International Holdings Limited (HKG:173)?

Every investor in K Wah International Holdings Limited (HKG:173) should be aware of the most powerful shareholder groups. Generally speaking, as a company grows, institutions will increase their ownership. Conversely, insiders often decrease their ownership over time. I generally like to see some degree of insider ownership, even if only a little. As Nassim Nicholas Taleb said, ‘Don’t tell me what you think, tell me what you have in your portfolio.’
K. Wah International Holdings isn’t enormous, but it’s not particularly small either. It has a market capitalization of HK$12.00b, which means it would generally expect to see some institutions on the share registry. In the chart below below, we can see that institutional investors have bought into the company. We can zoom in on the different ownership groups, to learn more about 173.
Check out our latest analysis for K. Wah International Holdings
What Does The Institutional Ownership Tell Us About K. Wah International Holdings?
Institutional investors commonly compare their own returns to the returns of a commonly followed index. So they generally do consider buying larger companies that are included in the relevant benchmark index.
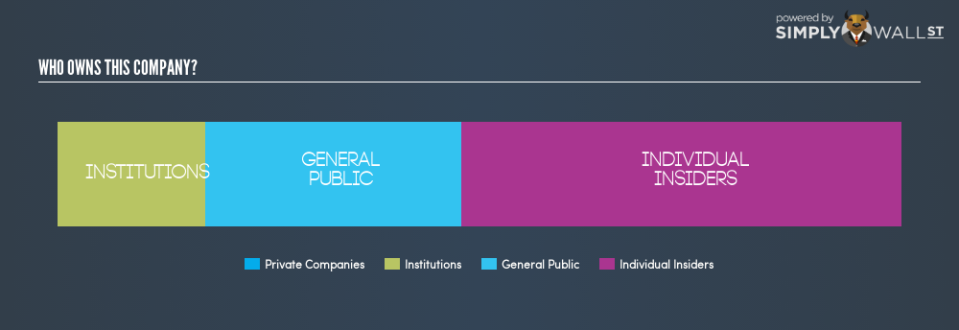
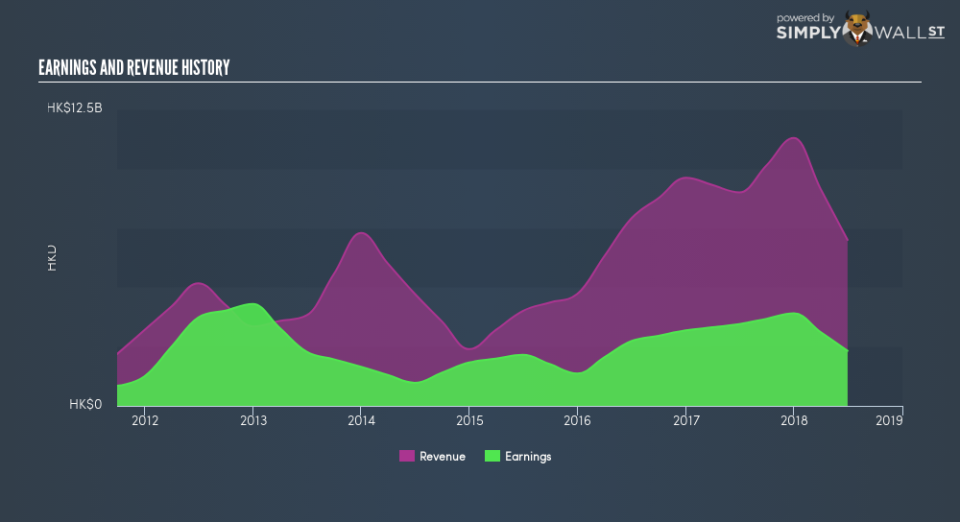
We can see that K. Wah International Holdings does have institutional investors; and they hold 17.5% of the stock. This can indicate that the company has a certain degree of credibility in the investment community. However, it is best to be wary of relying on the supposed validation that comes with institutional investors. They too, get it wrong sometimes. When multiple institutions own a stock, there’s always a risk that they are in a ‘crowded trade’. When such a trade goes wrong, multiple parties may compete to sell stock fast. This risk is higher in a company without a history of growth. You can see K. Wah International Holdings’s historic earnings and revenue, below, but keep in mind there’s always more to the story.
We note that hedge funds don’t have a meaningful investment in K. Wah International Holdings. There is some analyst coverage of the stock, but it could still become more well known, with time.
Insider Ownership Of K. Wah International Holdings
The definition of an insider can differ slightly between different countries, but members of the board of directors always count. Management ultimately answers to the board. However, it is not uncommon for managers to be executive board members, especially if they are a founder or the CEO.
Most consider insider ownership a positive because it can indicate the board is well aligned with other shareholders. However, on some occasions too much power is concentrated within this group.
Our information suggests that insiders own more than half of K Wah International Holdings Limited. This gives them effective control of the company. That means insiders have a very meaningful HK$6.25b stake in this HK$12.00b business. Most would be pleased to see the board is investing alongside them. You may wish to discover if they have been buying or selling.
General Public Ownership
With a 30.3% ownership, the general public have some degree of sway over 173. While this size of ownership may not be enough to sway a policy decision in their favour, they can still make a collective impact on company policies.
Next Steps:
I find it very interesting to look at who exactly owns a company. But to truly gain insight, we need to consider other information, too.
I like to dive deeper into how a company has performed in the past. You can access this interactive graph of past earnings, revenue and cash flow, for free .
If you would prefer discover what analysts are predicting in terms of future growth, do not miss this free report on analyst forecasts.
NB: Figures in this article are calculated using data from the last twelve months, which refer to the 12-month period ending on the last date of the month the financial statement is dated. This may not be consistent with full year annual report figures.
To help readers see past the short term volatility of the financial market, we aim to bring you a long-term focused research analysis purely driven by fundamental data. Note that our analysis does not factor in the latest price-sensitive company announcements.
The author is an independent contributor and at the time of publication had no position in the stocks mentioned. For errors that warrant correction please contact the editor at editorial-team@simplywallst.com.
