
 Yahoo Finance
 What Kind Of Shareholder Owns Most Sherritt International Corporation (TSE:S) Stock?

If you want to know who really controls Sherritt International Corporation (TSE:S), then you'll have to look at the makeup of its share registry. Institutions will often hold stock in bigger companies, and we expect to see insiders owning a noticeable percentage of the smaller ones. We also tend to see lower insider ownership in companies that were previously publicly owned.
Sherritt International is not a large company by global standards. It has a market capitalization of CA$153m, which means it wouldn't have the attention of many institutional investors. In the chart below below, we can see that institutions are noticeable on the share registry. We can zoom in on the different ownership groups, to learn more about S.
Check out our latest analysis for Sherritt International

What Does The Institutional Ownership Tell Us About Sherritt International?
Institutional investors commonly compare their own returns to the returns of a commonly followed index. So they generally do consider buying larger companies that are included in the relevant benchmark index.
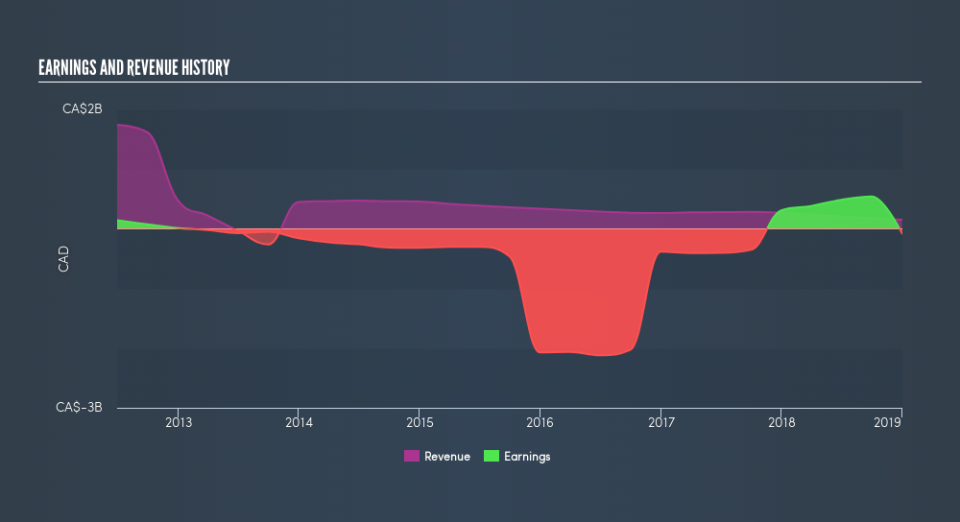
We can see that Sherritt International does have institutional investors; and they hold 20% of the stock. This implies the analysts working for those institutions have looked at the stock and they like it. But just like anyone else, they could be wrong. If multiple institutions change their view on a stock at the same time, you could see the share price drop fast. It's therefore worth looking at Sherritt International's earnings history, below. Of course, the future is what really matters.
We note that hedge funds don't have a meaningful investment in Sherritt International. There are plenty of analysts covering the stock, so it might be worth seeing what they are forecasting, too.
Insider Ownership Of Sherritt International
The definition of company insiders can be subjective, and does vary between jurisdictions. Our data reflects individual insiders, capturing board members at the very least. Management ultimately answers to the board. However, it is not uncommon for managers to be executive board members, especially if they are a founder or the CEO.
I generally consider insider ownership to be a good thing. However, on some occasions it makes it more difficult for other shareholders to hold the board accountable for decisions.
Our information suggests that Sherritt International Corporation insiders own under 1% of the company. It seems the board members have no more than CA$558k worth of shares in the CA$153m company. Many tend to prefer to see a board with bigger shareholdings. A good next step might be to take a look at this free summary of insider buying and selling.
General Public Ownership
The general public -- mostly retail investors -- own 80% of Sherritt International . This level of ownership gives retail investors the power to sway key policy decisions such as board composition, executive compensation, and the dividend payout ratio.
Next Steps:
While it is well worth considering the different groups that own a company, there are other factors that are even more important.
I always like to check for a history of revenue growth. You can too, by accessing this free chart of historic revenue and earnings in this detailed graph.
Ultimately the future is most important. You can access this free report on analyst forecasts for the company.
NB: Figures in this article are calculated using data from the last twelve months, which refer to the 12-month period ending on the last date of the month the financial statement is dated. This may not be consistent with full year annual report figures.
We aim to bring you long-term focused research analysis driven by fundamental data. Note that our analysis may not factor in the latest price-sensitive company announcements or qualitative material.
If you spot an error that warrants correction, please contact the editor at editorial-team@simplywallst.com. This article by Simply Wall St is general in nature. It does not constitute a recommendation to buy or sell any stock, and does not take account of your objectives, or your financial situation. Simply Wall St has no position in the stocks mentioned. Thank you for reading.
