
 Yahoo Finance
 Kerry Group PLC's Dividend Analysis
Exploring the Upcoming Dividend and Historical Performance of Kerry Group PLC
Kerry Group PLC (KRYAY) recently announced a dividend of $0.88 per share, payable on 2024-05-20, with the ex-dividend date set for 2024-04-11. As investors look forward to this upcoming payment, the spotlight also shines on the company's dividend history, yield, and growth rates. Using the data from GuruFocus, let's look into Kerry Group PLC's dividend performance and assess its sustainability.
What Does Kerry Group PLC Do?
This Powerful Chart Made Peter Lynch 29% A Year For 13 Years
How to calculate the intrinsic value of a stock?
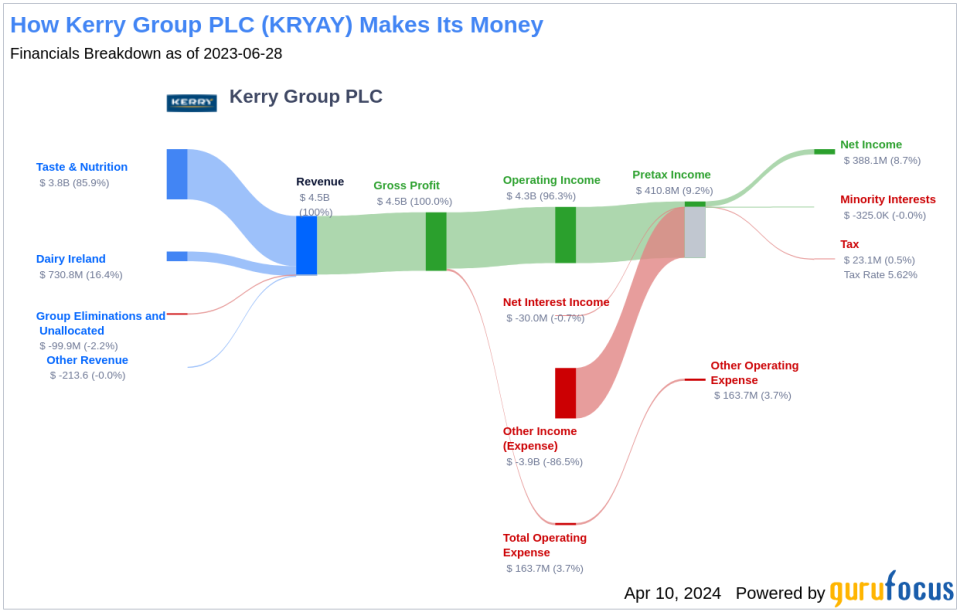
Kerry Group is a global leader in taste and ingredient technology servicing the food, beverage, and pharmaceutical sectors. The company has more than 200 locations that supply clients in more than 50 countries. It gets around 80% of its revenue from developed countries and 20% from the developing world, servicing a wide range of end-use sectors, such as meat, meals, snacks, dairy, drinks, and pharmaceuticals. Kerry has expanded through a combination of organic development and multiple tuck-in acquisitions.
A Glimpse at Kerry Group PLC's Dividend History
Kerry Group PLC has maintained a consistent dividend payment record since 2005. Dividends are currently distributed on a bi-annually basis. Kerry Group PLC has increased its dividend each year since 2010. The stock is thus listed as a dividend achiever, an honor that is given to companies that have increased their dividend each year for at least the past 14 years. Below is a chart showing annual Dividends Per Share for tracking historical trends.
Breaking Down Kerry Group PLC's Dividend Yield and Growth
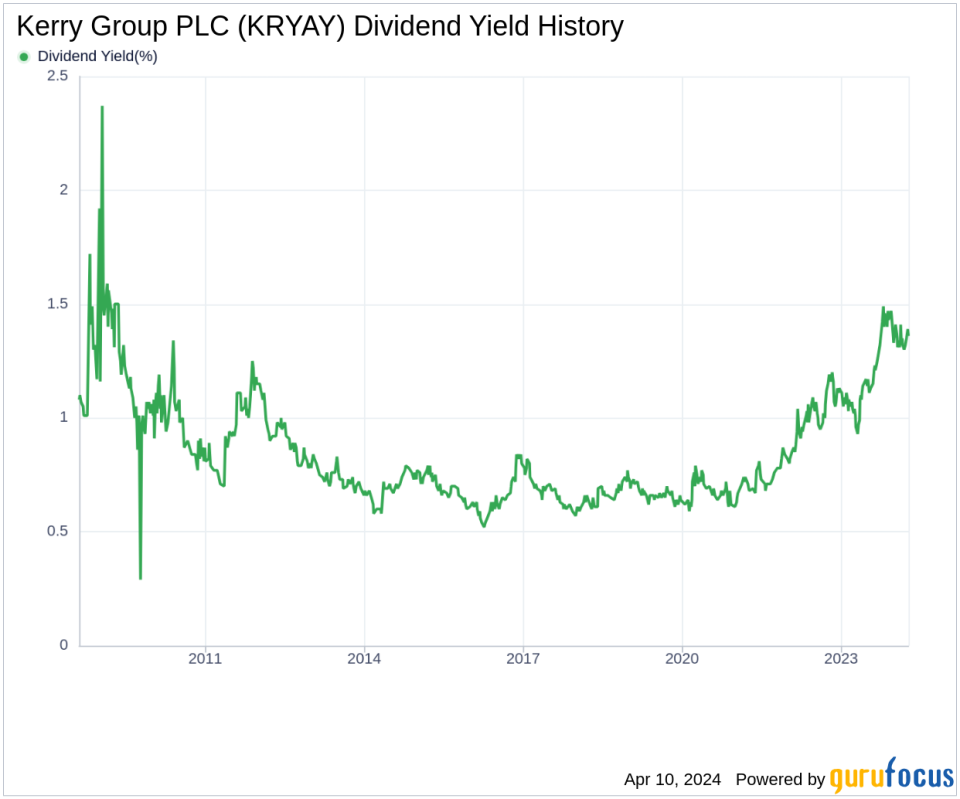
As of today, Kerry Group PLC currently has a 12-month trailing dividend yield of 1.37% and a 12-month forward dividend yield of 1.46%. This suggests an expectation of increased dividend payments over the next 12 months. Kerry Group PLC's dividend yield of 1.37% is near a 10-year high and outperforms 27.56% of global competitors in the Consumer Packaged Goods industry, suggesting that the company's dividend yield stands out as an attractive proposition for income investors.
Over the past three years, Kerry Group PLC's annual dividend growth rate was 10.10%. Extended to a five-year horizon, this rate increased to 10.70% per year. And over the past decade, Kerry Group PLC's annual dividends per share growth rate stands at an impressive 11.40%.
Based on Kerry Group PLC's dividend yield and five-year growth rate, the 5-year yield on cost of Kerry Group PLC stock as of today is approximately 2.28%.
The Sustainability Question: Payout Ratio and Profitability
To assess the sustainability of the dividend, one needs to evaluate the company's payout ratio. The dividend payout ratio provides insights into the portion of earnings the company distributes as dividends. A lower ratio suggests that the company retains a significant part of its earnings, thereby ensuring the availability of funds for future growth and unexpected downturns. As of 2023-12-31, Kerry Group PLC's dividend payout ratio is 0.26.
Kerry Group PLC's profitability rank, offers an understanding of the company's earnings prowess relative to its peers. GuruFocus ranks Kerry Group PLC's profitability 8 out of 10 as of 2023-12-31, suggesting good profitability prospects. The company has reported positive net income for each of year over the past decade, further solidifying its high profitability.
Growth Metrics: The Future Outlook
To ensure the sustainability of dividends, a company must have robust growth metrics. Kerry Group PLC's growth rank of 8 out of 10 suggests that the company's growth trajectory is good relative to its competitors.
Revenue is the lifeblood of any company, and Kerry Group PLC's revenue per share, combined with the 3-year revenue growth rate, indicates a strong revenue model. Kerry Group PLC's revenue has increased by approximately 4.80% per year on average, a rate that underperforms approximately 58.95% of global competitors.
The company's 3-year EPS growth rate showcases its capability to grow its earnings, a critical component for sustaining dividends in the long run. During the past three years, Kerry Group PLC's earnings increased by approximately 8.20% per year on average, a rate that underperforms approximately 49.47% of global competitors.
Lastly, the company's 5-year EBITDA growth rate of 4.10%, which underperforms approximately 53.46% of global competitors.
Concluding Thoughts on Kerry Group PLC's Dividend Outlook
Considering Kerry Group PLC's history of consistent dividend payments and growth, alongside a moderate payout ratio and strong profitability rank, the company stands as an attractive candidate for dividend investors. While growth metrics such as revenue and earnings per share growth rates may not lead the industry, they are nonetheless stable and indicative of a company that can maintain its dividend commitments. As value investors consider the future prospects of Kerry Group PLC, they should weigh these factors to determine if the stock aligns with their investment strategies. For those seeking to expand their portfolio with high-dividend yield stocks, GuruFocus Premium users can utilize the High Dividend Yield Screener to discover similar investment opportunities.
This article, generated by GuruFocus, is designed to provide general insights and is not tailored financial advice. Our commentary is rooted in historical data and analyst projections, utilizing an impartial methodology, and is not intended to serve as specific investment guidance. It does not formulate a recommendation to purchase or divest any stock and does not consider individual investment objectives or financial circumstances. Our objective is to deliver long-term, fundamental data-driven analysis. Be aware that our analysis might not incorporate the most recent, price-sensitive company announcements or qualitative information. GuruFocus holds no position in the stocks mentioned herein.
This article first appeared on GuruFocus.
