
 Yahoo Finance
 What Is Kathmandu Holdings's (NZSE:KMD) P/E Ratio After Its Share Price Tanked?

Unfortunately for some shareholders, the Kathmandu Holdings (NZSE:KMD) share price has dived 33% in the last thirty days. The bad news is that the recent drop obliterated the last year's worth of gains; the stock is flat over twelve months.
All else being equal, a share price drop should make a stock more attractive to potential investors. In the long term, share prices tend to follow earnings per share, but in the short term prices bounce around in response to short term factors (which are not always obvious). The implication here is that long term investors have an opportunity when expectations of a company are too low. One way to gauge market expectations of a stock is to look at its Price to Earnings Ratio (PE Ratio). A high P/E implies that investors have high expectations of what a company can achieve compared to a company with a low P/E ratio.
Check out our latest analysis for Kathmandu Holdings
Does Kathmandu Holdings Have A Relatively High Or Low P/E For Its Industry?
We can tell from its P/E ratio of 9.22 that sentiment around Kathmandu Holdings isn't particularly high. The image below shows that Kathmandu Holdings has a lower P/E than the average (11.3) P/E for companies in the specialty retail industry.
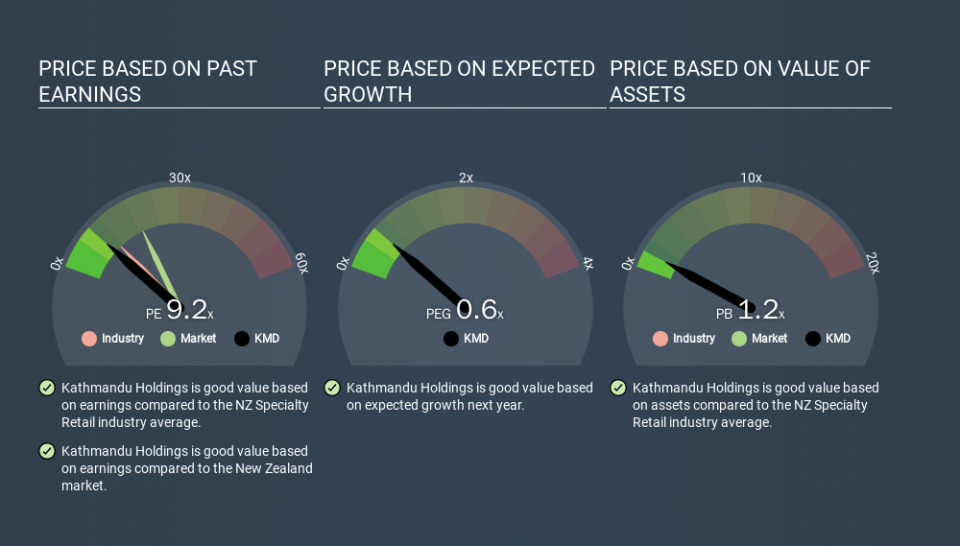
Kathmandu Holdings's P/E tells us that market participants think it will not fare as well as its peers in the same industry. While current expectations are low, the stock could be undervalued if the situation is better than the market assumes. It is arguably worth checking if insiders are buying shares, because that might imply they believe the stock is undervalued.
How Growth Rates Impact P/E Ratios
P/E ratios primarily reflect market expectations around earnings growth rates. Earnings growth means that in the future the 'E' will be higher. And in that case, the P/E ratio itself will drop rather quickly. And as that P/E ratio drops, the company will look cheap, unless its share price increases.
Kathmandu Holdings increased earnings per share by 6.3% last year. And its annual EPS growth rate over 5 years is 3.9%.
A Limitation: P/E Ratios Ignore Debt and Cash In The Bank
Don't forget that the P/E ratio considers market capitalization. That means it doesn't take debt or cash into account. The exact same company would hypothetically deserve a higher P/E ratio if it had a strong balance sheet, than if it had a weak one with lots of debt, because a cashed up company can spend on growth.
Spending on growth might be good or bad a few years later, but the point is that the P/E ratio does not account for the option (or lack thereof).
How Does Kathmandu Holdings's Debt Impact Its P/E Ratio?
Kathmandu Holdings's net debt is 2.8% of its market cap. So it doesn't have as many options as it would with net cash, but its debt would not have much of an impact on its P/E ratio.
The Bottom Line On Kathmandu Holdings's P/E Ratio
Kathmandu Holdings has a P/E of 9.2. That's below the average in the NZ market, which is 19.1. The company does have a little debt, and EPS is moving in the right direction. If you believe growth will continue - or even increase - then the low P/E may signify opportunity. What can be absolutely certain is that the market has become more pessimistic about Kathmandu Holdings over the last month, with the P/E ratio falling from 13.8 back then to 9.2 today. For those who prefer invest in growth, this stock apparently offers limited promise, but the deep value investors may find the pessimism around this stock enticing.
When the market is wrong about a stock, it gives savvy investors an opportunity. If it is underestimating a company, investors can make money by buying and holding the shares until the market corrects itself. So this free visual report on analyst forecasts could hold the key to an excellent investment decision.
Of course, you might find a fantastic investment by looking at a few good candidates. So take a peek at this free list of companies with modest (or no) debt, trading on a P/E below 20.
If you spot an error that warrants correction, please contact the editor at editorial-team@simplywallst.com. This article by Simply Wall St is general in nature. It does not constitute a recommendation to buy or sell any stock, and does not take account of your objectives, or your financial situation. Simply Wall St has no position in the stocks mentioned.
We aim to bring you long-term focused research analysis driven by fundamental data. Note that our analysis may not factor in the latest price-sensitive company announcements or qualitative material. Thank you for reading.
