
 Yahoo Finance
 Kathmandu Holdings (NZSE:KMD) Shares Have Generated A Total Return Of Negative 24% In The Last Year

Kathmandu Holdings Limited (NZSE:KMD) shareholders should be happy to see the share price up 12% in the last month. But in truth the last year hasn't been good for the share price. The cold reality is that the stock has dropped 52% in one year, under-performing the market.
Check out our latest analysis for Kathmandu Holdings
To paraphrase Benjamin Graham: Over the short term the market is a voting machine, but over the long term it's a weighing machine. One imperfect but simple way to consider how the market perception of a company has shifted is to compare the change in the earnings per share (EPS) with the share price movement.
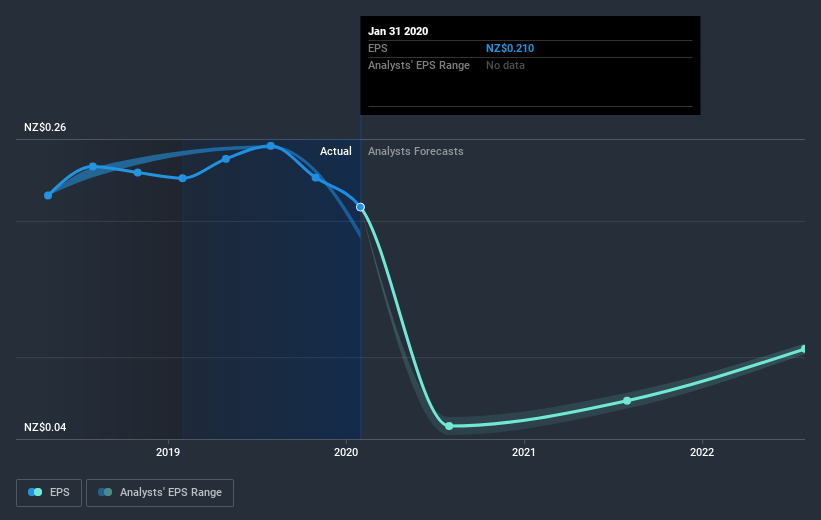
Unhappily, Kathmandu Holdings had to report a 9.2% decline in EPS over the last year. This reduction in EPS is not as bad as the 52% share price fall. Unsurprisingly, given the lack of EPS growth, the market seems to be more cautious about the stock. The P/E ratio of 5.86 also points to the negative market sentiment.
The company's earnings per share (over time) is depicted in the image below (click to see the exact numbers).
We consider it positive that insiders have made significant purchases in the last year. Having said that, most people consider earnings and revenue growth trends to be a more meaningful guide to the business. This free interactive report on Kathmandu Holdings' earnings, revenue and cash flow is a great place to start, if you want to investigate the stock further.
What about the Total Shareholder Return (TSR)?
We'd be remiss not to mention the difference between Kathmandu Holdings' total shareholder return (TSR) and its share price return. Arguably the TSR is a more complete return calculation because it accounts for the value of dividends (as if they were reinvested), along with the hypothetical value of any discounted capital that have been offered to shareholders. Kathmandu Holdings' TSR of was a loss of 24% for the year. That wasn't as bad as its share price return, because it has paid dividends.
A Different Perspective
Investors in Kathmandu Holdings had a tough year, with a total loss of 24%, against a market gain of about 4.3%. However, keep in mind that even the best stocks will sometimes underperform the market over a twelve month period. Longer term investors wouldn't be so upset, since they would have made 11%, each year, over five years. It could be that the recent sell-off is an opportunity, so it may be worth checking the fundamental data for signs of a long term growth trend. I find it very interesting to look at share price over the long term as a proxy for business performance. But to truly gain insight, we need to consider other information, too. Take risks, for example - Kathmandu Holdings has 2 warning signs (and 1 which is significant) we think you should know about.
Kathmandu Holdings is not the only stock that insiders are buying. For those who like to find winning investments this free list of growing companies with recent insider purchasing, could be just the ticket.
Please note, the market returns quoted in this article reflect the market weighted average returns of stocks that currently trade on NZ exchanges.
This article by Simply Wall St is general in nature. It does not constitute a recommendation to buy or sell any stock, and does not take account of your objectives, or your financial situation. We aim to bring you long-term focused analysis driven by fundamental data. Note that our analysis may not factor in the latest price-sensitive company announcements or qualitative material. Simply Wall St has no position in any stocks mentioned.
Have feedback on this article? Concerned about the content? Get in touch with us directly. Alternatively, email editorial-team@simplywallst.com.
