
 Yahoo Finance
 Is Kape Technologies Plc's (LON:KAPE) CEO Overpaid Relative To Its Peers?

Ido Erlichman became the CEO of Kape Technologies Plc (LON:KAPE) in 2016. This report will, first, examine the CEO compensation levels in comparison to CEO compensation at companies of similar size. Next, we'll consider growth that the business demonstrates. And finally we will reflect on how common stockholders have fared in the last few years, as a secondary measure of performance. This process should give us an idea about how appropriately the CEO is paid.
View our latest analysis for Kape Technologies
How Does Ido Erlichman's Compensation Compare With Similar Sized Companies?
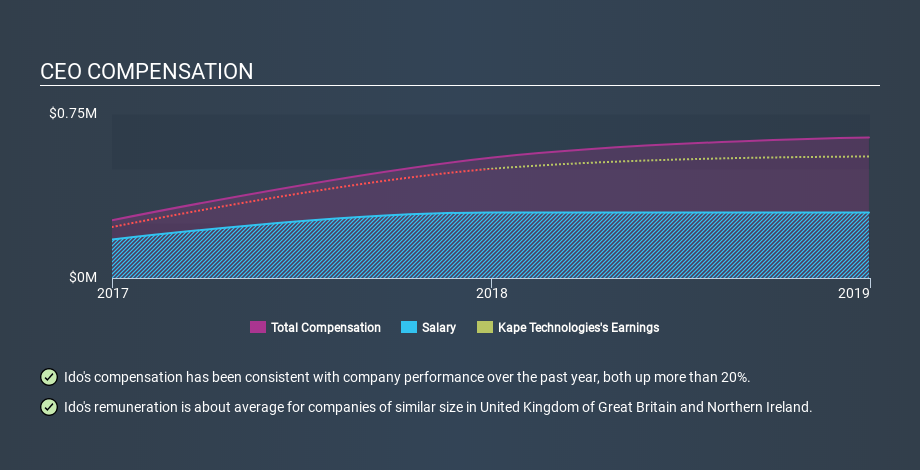
At the time of writing, our data says that Kape Technologies Plc has a market cap of UK£269m, and reported total annual CEO compensation of US$642k for the year to December 2018. While we always look at total compensation first, we note that the salary component is less, at US$300k. When we examined a selection of companies with market caps ranging from UK£152m to UK£606m, we found the median CEO total compensation was UK£661k.
So Ido Erlichman is paid around the average of the companies we looked at. While this data point isn't particularly informative alone, it gains more meaning when considered with business performance.
You can see a visual representation of the CEO compensation at Kape Technologies, below.
Is Kape Technologies Plc Growing?
On average over the last three years, Kape Technologies Plc has grown earnings per share (EPS) by 102% each year (using a line of best fit). It achieved revenue growth of 30% over the last year.
This shows that the company has improved itself over the last few years. Good news for shareholders. The combination of strong revenue growth with medium-term earnings per share improvement certainly points to the kind of growth I like to see. It could be important to check this free visual depiction of what analysts expect for the future.
Has Kape Technologies Plc Been A Good Investment?
I think that the total shareholder return of 243%, over three years, would leave most Kape Technologies Plc shareholders smiling. So they may not be at all concerned if the CEO were to be paid more than is normal for companies around the same size.
In Summary...
Remuneration for Ido Erlichman is close enough to the median pay for a CEO of a similar sized company .
The company is growing earnings per share and total shareholder returns have been pleasing. Although the pay is a normal amount, some shareholders probably consider it fair or modest, given the good performance of the stock. CEO compensation is one thing, but it is also interesting to check if the CEO is buying or selling Kape Technologies (free visualization of insider trades).
Arguably, business quality is much more important than CEO compensation levels. So check out this free list of interesting companies, that have HIGH return on equity and low debt.
If you spot an error that warrants correction, please contact the editor at editorial-team@simplywallst.com. This article by Simply Wall St is general in nature. It does not constitute a recommendation to buy or sell any stock, and does not take account of your objectives, or your financial situation. Simply Wall St has no position in the stocks mentioned.
We aim to bring you long-term focused research analysis driven by fundamental data. Note that our analysis may not factor in the latest price-sensitive company announcements or qualitative material. Thank you for reading.
