
 Yahoo Finance
 Should You Like Johns Lyng Group Limited’s (ASX:JLG) High Return On Capital Employed?

Today we'll evaluate Johns Lyng Group Limited (ASX:JLG) to determine whether it could have potential as an investment idea. Specifically, we're going to calculate its Return On Capital Employed (ROCE), in the hopes of getting some insight into the business.
First of all, we'll work out how to calculate ROCE. Then we'll compare its ROCE to similar companies. Finally, we'll look at how its current liabilities affect its ROCE.
Return On Capital Employed (ROCE): What is it?
ROCE measures the amount of pre-tax profits a company can generate from the capital employed in its business. Generally speaking a higher ROCE is better. Overall, it is a valuable metric that has its flaws. Renowned investment researcher Michael Mauboussin has suggested that a high ROCE can indicate that 'one dollar invested in the company generates value of more than one dollar'.
How Do You Calculate Return On Capital Employed?
Analysts use this formula to calculate return on capital employed:
Return on Capital Employed = Earnings Before Interest and Tax (EBIT) ÷ (Total Assets - Current Liabilities)
Or for Johns Lyng Group:
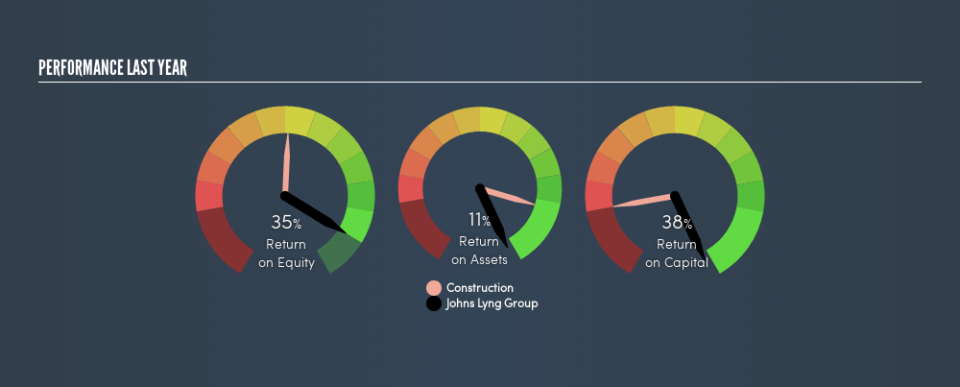
0.38 = AU$16m ÷ (AU$107m - AU$64m) (Based on the trailing twelve months to December 2018.)
So, Johns Lyng Group has an ROCE of 38%.
Want to participate in a short research study? Help shape the future of investing tools and you could win a $250 gift card!
See our latest analysis for Johns Lyng Group
Does Johns Lyng Group Have A Good ROCE?
When making comparisons between similar businesses, investors may find ROCE useful. Using our data, we find that Johns Lyng Group's ROCE is meaningfully better than the 20% average in the Construction industry. We would consider this a positive, as it suggests it is using capital more effectively than other similar companies. Regardless of the industry comparison, in absolute terms, Johns Lyng Group's ROCE currently appears to be excellent.
Remember that this metric is backwards looking - it shows what has happened in the past, and does not accurately predict the future. Companies in cyclical industries can be difficult to understand using ROCE, as returns typically look high during boom times, and low during busts. ROCE is only a point-in-time measure. How cyclical is Johns Lyng Group? You can see for yourself by looking at this free graph of past earnings, revenue and cash flow.
How Johns Lyng Group's Current Liabilities Impact Its ROCE
Liabilities, such as supplier bills and bank overdrafts, are referred to as current liabilities if they need to be paid within 12 months. Due to the way ROCE is calculated, a high level of current liabilities makes a company look as though it has less capital employed, and thus can (sometimes unfairly) boost the ROCE. To check the impact of this, we calculate if a company has high current liabilities relative to its total assets.
Johns Lyng Group has total assets of AU$107m and current liabilities of AU$64m. Therefore its current liabilities are equivalent to approximately 60% of its total assets. Johns Lyng Group's high level of current liabilities boost the ROCE - but its ROCE is still impressive.
Our Take On Johns Lyng Group's ROCE
In my book, this business could be worthy of further research. Johns Lyng Group shapes up well under this analysis, but it is far from the only business delivering excellent numbers . You might also want to check this free collection of companies delivering excellent earnings growth.
If you like to buy stocks alongside management, then you might just love this free list of companies. (Hint: insiders have been buying them).
We aim to bring you long-term focused research analysis driven by fundamental data. Note that our analysis may not factor in the latest price-sensitive company announcements or qualitative material.
If you spot an error that warrants correction, please contact the editor at editorial-team@simplywallst.com. This article by Simply Wall St is general in nature. It does not constitute a recommendation to buy or sell any stock, and does not take account of your objectives, or your financial situation. Simply Wall St has no position in the stocks mentioned. Thank you for reading.