
 Yahoo Finance
 Jefferies Financial Group (NYSE:JEF) shareholders have earned a 40% CAGR over the last three years
Jefferies Financial Group Inc. (NYSE:JEF) shareholders might be concerned after seeing the share price drop 24% in the last quarter. But in three years the returns have been great. The share price marched upwards over that time, and is now 138% higher than it was. To some, the recent share price pullback wouldn't be surprising after such a good run. If the business can perform well for years to come, then the recent drop could be an opportunity.
So let's investigate and see if the longer term performance of the company has been in line with the underlying business' progress.
View our latest analysis for Jefferies Financial Group
While the efficient markets hypothesis continues to be taught by some, it has been proven that markets are over-reactive dynamic systems, and investors are not always rational. One flawed but reasonable way to assess how sentiment around a company has changed is to compare the earnings per share (EPS) with the share price.
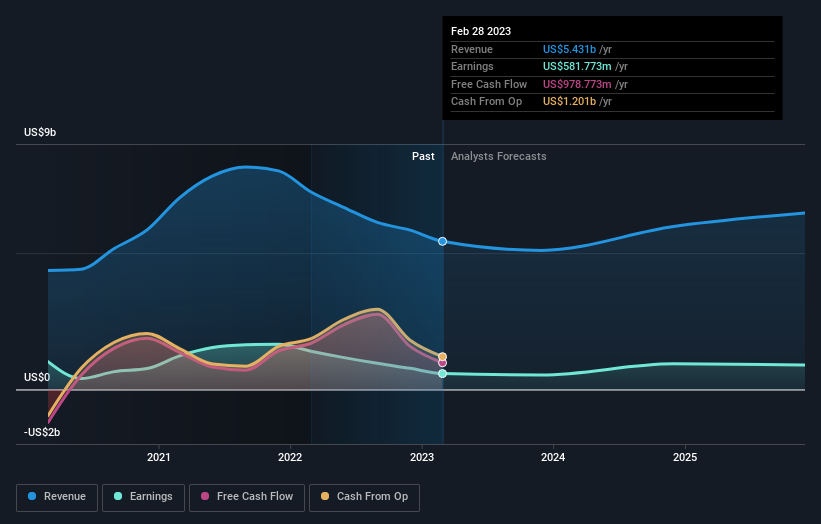
Over the last three years, Jefferies Financial Group failed to grow earnings per share, which fell 9.1% (annualized).
This means it's unlikely the market is judging the company based on earnings growth. Therefore, we think it's worth considering other metrics as well.
It may well be that Jefferies Financial Group revenue growth rate of 7.1% over three years has convinced shareholders to believe in a brighter future. If the company is being managed for the long term good, today's shareholders might be right to hold on.
You can see below how earnings and revenue have changed over time (discover the exact values by clicking on the image).
We consider it positive that insiders have made significant purchases in the last year. Having said that, most people consider earnings and revenue growth trends to be a more meaningful guide to the business. So we recommend checking out this free report showing consensus forecasts
What About Dividends?
When looking at investment returns, it is important to consider the difference between total shareholder return (TSR) and share price return. The TSR incorporates the value of any spin-offs or discounted capital raisings, along with any dividends, based on the assumption that the dividends are reinvested. So for companies that pay a generous dividend, the TSR is often a lot higher than the share price return. In the case of Jefferies Financial Group, it has a TSR of 174% for the last 3 years. That exceeds its share price return that we previously mentioned. The dividends paid by the company have thusly boosted the total shareholder return.
A Different Perspective
It's good to see that Jefferies Financial Group has rewarded shareholders with a total shareholder return of 5.4% in the last twelve months. And that does include the dividend. Having said that, the five-year TSR of 10% a year, is even better. Potential buyers might understandably feel they've missed the opportunity, but it's always possible business is still firing on all cylinders. It's always interesting to track share price performance over the longer term. But to understand Jefferies Financial Group better, we need to consider many other factors. For instance, we've identified 2 warning signs for Jefferies Financial Group that you should be aware of.
Jefferies Financial Group is not the only stock insiders are buying. So take a peek at this free list of growing companies with insider buying.
Please note, the market returns quoted in this article reflect the market weighted average returns of stocks that currently trade on American exchanges.
Have feedback on this article? Concerned about the content? Get in touch with us directly. Alternatively, email editorial-team (at) simplywallst.com.
This article by Simply Wall St is general in nature. We provide commentary based on historical data and analyst forecasts only using an unbiased methodology and our articles are not intended to be financial advice. It does not constitute a recommendation to buy or sell any stock, and does not take account of your objectives, or your financial situation. We aim to bring you long-term focused analysis driven by fundamental data. Note that our analysis may not factor in the latest price-sensitive company announcements or qualitative material. Simply Wall St has no position in any stocks mentioned.
Join A Paid User Research Session
You’ll receive a US$30 Amazon Gift card for 1 hour of your time while helping us build better investing tools for the individual investors like yourself. Sign up here
