
 Yahoo Finance
 JD.com (NASDAQ:JD) Is Doing The Right Things To Multiply Its Share Price
Did you know there are some financial metrics that can provide clues of a potential multi-bagger? Amongst other things, we'll want to see two things; firstly, a growing return on capital employed (ROCE) and secondly, an expansion in the company's amount of capital employed. Ultimately, this demonstrates that it's a business that is reinvesting profits at increasing rates of return. With that in mind, we've noticed some promising trends at JD.com (NASDAQ:JD) so let's look a bit deeper.
Return On Capital Employed (ROCE): What Is It?
For those that aren't sure what ROCE is, it measures the amount of pre-tax profits a company can generate from the capital employed in its business. Analysts use this formula to calculate it for JD.com:
Return on Capital Employed = Earnings Before Interest and Tax (EBIT) ÷ (Total Assets - Current Liabilities)
0.086 = CN¥31b ÷ (CN¥602b - CN¥246b) (Based on the trailing twelve months to March 2024).
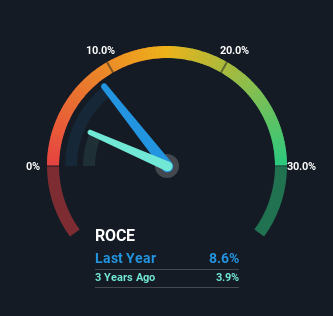
Therefore, JD.com has an ROCE of 8.6%. In absolute terms, that's a low return and it also under-performs the Multiline Retail industry average of 11%.
See our latest analysis for JD.com
In the above chart we have measured JD.com's prior ROCE against its prior performance, but the future is arguably more important. If you're interested, you can view the analysts predictions in our free analyst report for JD.com .
So How Is JD.com's ROCE Trending?
JD.com has recently broken into profitability so their prior investments seem to be paying off. About five years ago the company was generating losses but things have turned around because it's now earning 8.6% on its capital. Not only that, but the company is utilizing 258% more capital than before, but that's to be expected from a company trying to break into profitability. This can indicate that there's plenty of opportunities to invest capital internally and at ever higher rates, both common traits of a multi-bagger.
On a related note, the company's ratio of current liabilities to total assets has decreased to 41%, which basically reduces it's funding from the likes of short-term creditors or suppliers. This tells us that JD.com has grown its returns without a reliance on increasing their current liabilities, which we're very happy with. However, current liabilities are still at a pretty high level, so just be aware that this can bring with it some risks.
In Conclusion...
Long story short, we're delighted to see that JD.com's reinvestment activities have paid off and the company is now profitable. Investors may not be impressed by the favorable underlying trends yet because over the last five years the stock has only returned 8.1% to shareholders. Given that, we'd look further into this stock in case it has more traits that could make it multiply in the long term.
One more thing, we've spotted 1 warning sign facing JD.com that you might find interesting.
If you want to search for solid companies with great earnings, check out this free list of companies with good balance sheets and impressive returns on equity.
Have feedback on this article? Concerned about the content? Get in touch with us directly. Alternatively, email editorial-team (at) simplywallst.com.
This article by Simply Wall St is general in nature. We provide commentary based on historical data and analyst forecasts only using an unbiased methodology and our articles are not intended to be financial advice. It does not constitute a recommendation to buy or sell any stock, and does not take account of your objectives, or your financial situation. We aim to bring you long-term focused analysis driven by fundamental data. Note that our analysis may not factor in the latest price-sensitive company announcements or qualitative material. Simply Wall St has no position in any stocks mentioned.
Have feedback on this article? Concerned about the content? Get in touch with us directly. Alternatively, email editorial-team@simplywallst.com
