
 Yahoo Finance
 ITT Inc. (NYSE:ITT): Financial Strength Analysis
Small-caps and large-caps are wildly popular among investors, however, mid-cap stocks, such as ITT Inc. (NYSE:ITT), with a market capitalization of US$5.0b, rarely draw their attention from the investing community. However, generally ignored mid-caps have historically delivered better risk adjusted returns than both of those groups. ITT’s financial liquidity and debt position will be analysed in this article, to get an idea of whether the company can fund opportunities for strategic growth and maintain strength through economic downturns. Remember this is a very top-level look that focuses exclusively on financial health, so I recommend a deeper analysis into ITT here.
View our latest analysis for ITT
ITT’s Debt (And Cash Flows)
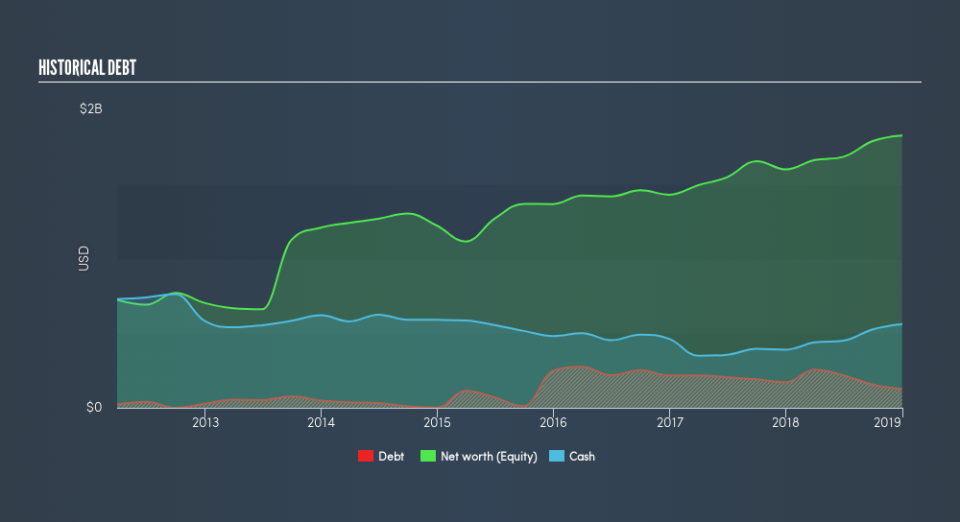
Over the past year, ITT has reduced its debt from US$172m to US$125m , which includes long-term debt. With this debt repayment, ITT’s cash and short-term investments stands at US$561m to keep the business going. Additionally, ITT has generated US$368m in operating cash flow during the same period of time, resulting in an operating cash to total debt ratio of 294%, signalling that ITT’s current level of operating cash is high enough to cover debt.
Can ITT meet its short-term obligations with the cash in hand?
Looking at ITT’s US$872m in current liabilities, it appears that the company has maintained a safe level of current assets to meet its obligations, with the current ratio last standing at 1.89x. The current ratio is calculated by dividing current assets by current liabilities. Generally, for Machinery companies, this is a reasonable ratio since there is a bit of a cash buffer without leaving too much capital in a low-return environment.
Does ITT face the risk of succumbing to its debt-load?
ITT’s level of debt is low relative to its total equity, at 6.8%. ITT is not taking on too much debt commitment, which can be restrictive and risky for equity-holders. We can check to see whether ITT is able to meet its debt obligations by looking at the net interest coverage ratio. A company generating earnings before interest and tax (EBIT) at least three times its net interest payments is considered financially sound. In ITT’s, case, the ratio of 896x suggests that interest is comfortably covered, which means that lenders may be inclined to lend more money to the company, as it is seen as safe in terms of payback.
Next Steps:
ITT’s high cash coverage and low debt levels indicate its ability to utilise its borrowings efficiently in order to generate ample cash flow. Furthermore, the company exhibits proper management of current assets and upcoming liabilities. I admit this is a fairly basic analysis for ITT’s financial health. Other important fundamentals need to be considered alongside. I recommend you continue to research ITT to get a better picture of the stock by looking at:
Future Outlook: What are well-informed industry analysts predicting for ITT’s future growth? Take a look at our free research report of analyst consensus for ITT’s outlook.
Valuation: What is ITT worth today? Is the stock undervalued, even when its growth outlook is factored into its intrinsic value? The intrinsic value infographic in our free research report helps visualize whether ITT is currently mispriced by the market.
Other High-Performing Stocks: Are there other stocks that provide better prospects with proven track records? Explore our free list of these great stocks here.
We aim to bring you long-term focused research analysis driven by fundamental data. Note that our analysis may not factor in the latest price-sensitive company announcements or qualitative material.
If you spot an error that warrants correction, please contact the editor at editorial-team@simplywallst.com. This article by Simply Wall St is general in nature. It does not constitute a recommendation to buy or sell any stock, and does not take account of your objectives, or your financial situation. Simply Wall St has no position in the stocks mentioned. Thank you for reading.
