
 Yahoo Finance
 Investors in Young's Brewery (LON:YNGA) have unfortunately lost 40% over the last five years
The main aim of stock picking is to find the market-beating stocks. But every investor is virtually certain to have both over-performing and under-performing stocks. At this point some shareholders may be questioning their investment in Young & Co.'s Brewery, P.L.C. (LON:YNGA), since the last five years saw the share price fall 43%. Furthermore, it's down 14% in about a quarter. That's not much fun for holders.
So let's have a look and see if the longer term performance of the company has been in line with the underlying business' progress.
View our latest analysis for Young's Brewery
To quote Buffett, 'Ships will sail around the world but the Flat Earth Society will flourish. There will continue to be wide discrepancies between price and value in the marketplace...' One imperfect but simple way to consider how the market perception of a company has shifted is to compare the change in the earnings per share (EPS) with the share price movement.
Young's Brewery became profitable within the last five years. Most would consider that to be a good thing, so it's counter-intuitive to see the share price declining. Other metrics might give us a better handle on how its value is changing over time.
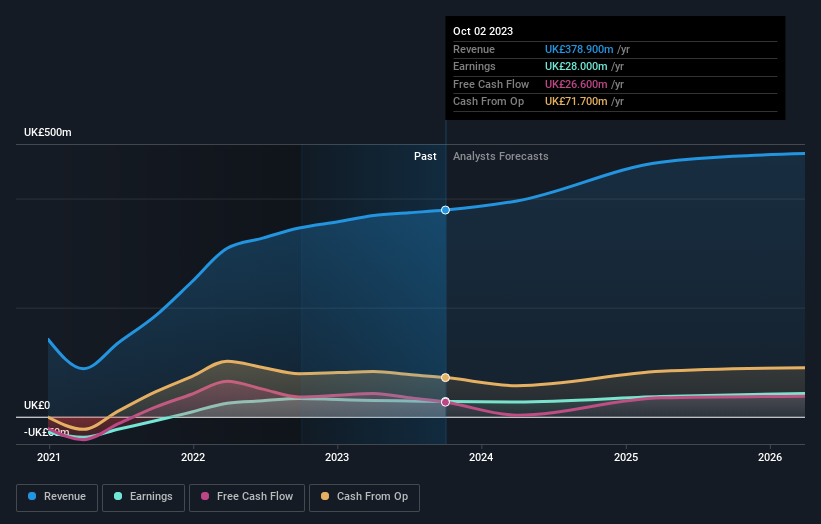
In contrast to the share price, revenue has actually increased by 4.9% a year in the five year period. So it seems one might have to take closer look at the fundamentals to understand why the share price languishes. After all, there may be an opportunity.
You can see below how earnings and revenue have changed over time (discover the exact values by clicking on the image).
We know that Young's Brewery has improved its bottom line over the last three years, but what does the future have in store? You can see how its balance sheet has strengthened (or weakened) over time in this free interactive graphic.
What About Dividends?
When looking at investment returns, it is important to consider the difference between total shareholder return (TSR) and share price return. The TSR incorporates the value of any spin-offs or discounted capital raisings, along with any dividends, based on the assumption that the dividends are reinvested. It's fair to say that the TSR gives a more complete picture for stocks that pay a dividend. As it happens, Young's Brewery's TSR for the last 5 years was -40%, which exceeds the share price return mentioned earlier. This is largely a result of its dividend payments!
A Different Perspective
Investors in Young's Brewery had a tough year, with a total loss of 11% (including dividends), against a market gain of about 5.2%. However, keep in mind that even the best stocks will sometimes underperform the market over a twelve month period. Unfortunately, last year's performance may indicate unresolved challenges, given that it was worse than the annualised loss of 7% over the last half decade. We realise that Baron Rothschild has said investors should "buy when there is blood on the streets", but we caution that investors should first be sure they are buying a high quality business. It's always interesting to track share price performance over the longer term. But to understand Young's Brewery better, we need to consider many other factors. Even so, be aware that Young's Brewery is showing 2 warning signs in our investment analysis , you should know about...
Of course, you might find a fantastic investment by looking elsewhere. So take a peek at this free list of companies we expect will grow earnings.
Please note, the market returns quoted in this article reflect the market weighted average returns of stocks that currently trade on British exchanges.
Have feedback on this article? Concerned about the content? Get in touch with us directly. Alternatively, email editorial-team (at) simplywallst.com.
This article by Simply Wall St is general in nature. We provide commentary based on historical data and analyst forecasts only using an unbiased methodology and our articles are not intended to be financial advice. It does not constitute a recommendation to buy or sell any stock, and does not take account of your objectives, or your financial situation. We aim to bring you long-term focused analysis driven by fundamental data. Note that our analysis may not factor in the latest price-sensitive company announcements or qualitative material. Simply Wall St has no position in any stocks mentioned.
