
 Yahoo Finance
 Investors in Westgold Resources (ASX:WGX) have unfortunately lost 61% over the last three years
While not a mind-blowing move, it is good to see that the Westgold Resources Limited (ASX:WGX) share price has gained 24% in the last three months. But that is small recompense for the exasperating returns over three years. Tragically, the share price declined 61% in that time. So it is really good to see an improvement. Perhaps the company has turned over a new leaf.
So let's have a look and see if the longer term performance of the company has been in line with the underlying business' progress.
View our latest analysis for Westgold Resources
In his essay The Superinvestors of Graham-and-Doddsville Warren Buffett described how share prices do not always rationally reflect the value of a business. By comparing earnings per share (EPS) and share price changes over time, we can get a feel for how investor attitudes to a company have morphed over time.
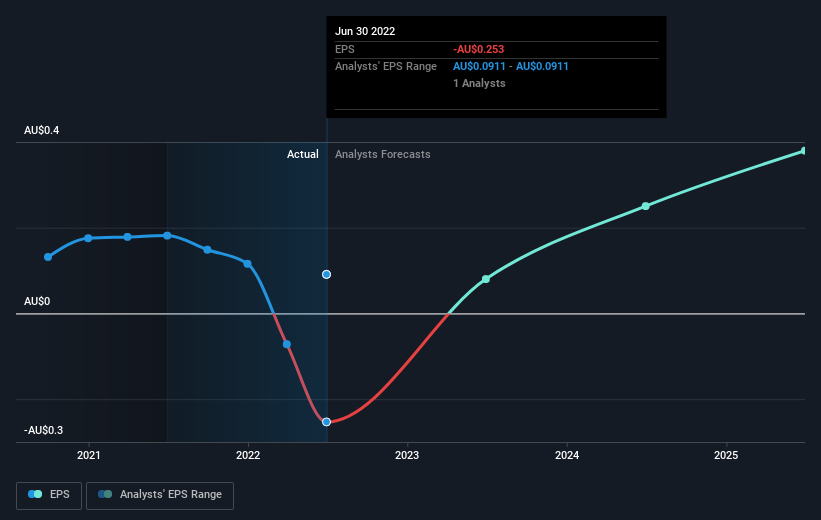
Over the three years that the share price declined, Westgold Resources' earnings per share (EPS) dropped significantly, falling to a loss. Due to the loss, it's not easy to use EPS as a reliable guide to the business. But it's safe to say we'd generally expect the share price to be lower as a result!
You can see below how EPS has changed over time (discover the exact values by clicking on the image).
This free interactive report on Westgold Resources' earnings, revenue and cash flow is a great place to start, if you want to investigate the stock further.
A Different Perspective
Westgold Resources shareholders are down 55% for the year (even including dividends), but the market itself is up 4.1%. However, keep in mind that even the best stocks will sometimes underperform the market over a twelve month period. Unfortunately, last year's performance may indicate unresolved challenges, given that it was worse than the annualised loss of 6% over the last half decade. Generally speaking long term share price weakness can be a bad sign, though contrarian investors might want to research the stock in hope of a turnaround. It's always interesting to track share price performance over the longer term. But to understand Westgold Resources better, we need to consider many other factors. Take risks, for example - Westgold Resources has 1 warning sign we think you should be aware of.
Of course Westgold Resources may not be the best stock to buy. So you may wish to see this free collection of growth stocks.
Please note, the market returns quoted in this article reflect the market weighted average returns of stocks that currently trade on AU exchanges.
Have feedback on this article? Concerned about the content? Get in touch with us directly. Alternatively, email editorial-team (at) simplywallst.com.
This article by Simply Wall St is general in nature. We provide commentary based on historical data and analyst forecasts only using an unbiased methodology and our articles are not intended to be financial advice. It does not constitute a recommendation to buy or sell any stock, and does not take account of your objectives, or your financial situation. We aim to bring you long-term focused analysis driven by fundamental data. Note that our analysis may not factor in the latest price-sensitive company announcements or qualitative material. Simply Wall St has no position in any stocks mentioned.
Join A Paid User Research Session
You’ll receive a US$30 Amazon Gift card for 1 hour of your time while helping us build better investing tools for the individual investors like yourself. Sign up here
