
 Yahoo Finance
 Investors Will Want Trinity Exploration & Production's (LON:TRIN) Growth In ROCE To Persist
If we want to find a potential multi-bagger, often there are underlying trends that can provide clues. Ideally, a business will show two trends; firstly a growing return on capital employed (ROCE) and secondly, an increasing amount of capital employed. Put simply, these types of businesses are compounding machines, meaning they are continually reinvesting their earnings at ever-higher rates of return. With that in mind, we've noticed some promising trends at Trinity Exploration & Production (LON:TRIN) so let's look a bit deeper.
Understanding Return On Capital Employed (ROCE)
Just to clarify if you're unsure, ROCE is a metric for evaluating how much pre-tax income (in percentage terms) a company earns on the capital invested in its business. To calculate this metric for Trinity Exploration & Production, this is the formula:
Return on Capital Employed = Earnings Before Interest and Tax (EBIT) ÷ (Total Assets - Current Liabilities)
0.033 = US$3.7m ÷ (US$136m - US$21m) (Based on the trailing twelve months to June 2022).
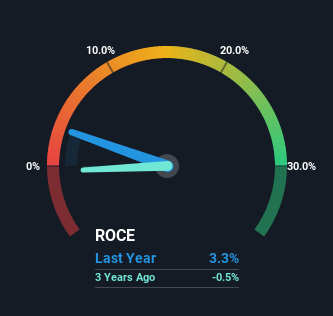
Therefore, Trinity Exploration & Production has an ROCE of 3.3%. In absolute terms, that's a low return and it also under-performs the Oil and Gas industry average of 11%.
See our latest analysis for Trinity Exploration & Production
Above you can see how the current ROCE for Trinity Exploration & Production compares to its prior returns on capital, but there's only so much you can tell from the past. If you'd like to see what analysts are forecasting going forward, you should check out our free report for Trinity Exploration & Production.
The Trend Of ROCE
We're delighted to see that Trinity Exploration & Production is reaping rewards from its investments and is now generating some pre-tax profits. Shareholders would no doubt be pleased with this because the business was loss-making five years ago but is is now generating 3.3% on its capital. And unsurprisingly, like most companies trying to break into the black, Trinity Exploration & Production is utilizing 37% more capital than it was five years ago. This can tell us that the company has plenty of reinvestment opportunities that are able to generate higher returns.
In Conclusion...
To the delight of most shareholders, Trinity Exploration & Production has now broken into profitability. Astute investors may have an opportunity here because the stock has declined 37% in the last five years. So researching this company further and determining whether or not these trends will continue seems justified.
If you'd like to know more about Trinity Exploration & Production, we've spotted 2 warning signs, and 1 of them can't be ignored.
For those who like to invest in solid companies, check out this free list of companies with solid balance sheets and high returns on equity.
Have feedback on this article? Concerned about the content? Get in touch with us directly. Alternatively, email editorial-team (at) simplywallst.com.
This article by Simply Wall St is general in nature. We provide commentary based on historical data and analyst forecasts only using an unbiased methodology and our articles are not intended to be financial advice. It does not constitute a recommendation to buy or sell any stock, and does not take account of your objectives, or your financial situation. We aim to bring you long-term focused analysis driven by fundamental data. Note that our analysis may not factor in the latest price-sensitive company announcements or qualitative material. Simply Wall St has no position in any stocks mentioned.
Join A Paid User Research Session
You’ll receive a US$30 Amazon Gift card for 1 hour of your time while helping us build better investing tools for the individual investors like yourself. Sign up here
