
 Yahoo Finance
 Investors Will Want Premier Investments' (ASX:PMV) Growth In ROCE To Persist
If we want to find a potential multi-bagger, often there are underlying trends that can provide clues. Typically, we'll want to notice a trend of growing return on capital employed (ROCE) and alongside that, an expanding base of capital employed. Ultimately, this demonstrates that it's a business that is reinvesting profits at increasing rates of return. So when we looked at Premier Investments (ASX:PMV) and its trend of ROCE, we really liked what we saw.
Understanding Return On Capital Employed (ROCE)
If you haven't worked with ROCE before, it measures the 'return' (pre-tax profit) a company generates from capital employed in its business. Analysts use this formula to calculate it for Premier Investments:
Return on Capital Employed = Earnings Before Interest and Tax (EBIT) ÷ (Total Assets - Current Liabilities)
0.18 = AU$330m ÷ (AU$2.3b - AU$426m) (Based on the trailing twelve months to January 2022).
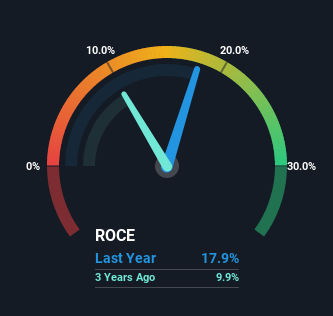
Thus, Premier Investments has an ROCE of 18%. In absolute terms, that's a pretty normal return, and it's somewhat close to the Specialty Retail industry average of 19%.
Check out our latest analysis for Premier Investments
In the above chart we have measured Premier Investments' prior ROCE against its prior performance, but the future is arguably more important. If you'd like to see what analysts are forecasting going forward, you should check out our free report for Premier Investments.
What Can We Tell From Premier Investments' ROCE Trend?
Premier Investments is showing promise given that its ROCE is trending up and to the right. Looking at the data, we can see that even though capital employed in the business has remained relatively flat, the ROCE generated has risen by 113% over the last five years. So it's likely that the business is now reaping the full benefits of its past investments, since the capital employed hasn't changed considerably. The company is doing well in that sense, and it's worth investigating what the management team has planned for long term growth prospects.
For the record though, there was a noticeable increase in the company's current liabilities over the period, so we would attribute some of the ROCE growth to that. Effectively this means that suppliers or short-term creditors are now funding 19% of the business, which is more than it was five years ago. Keep an eye out for future increases because when the ratio of current liabilities to total assets gets particularly high, this can introduce some new risks for the business.
In Conclusion...
To sum it up, Premier Investments is collecting higher returns from the same amount of capital, and that's impressive. And with the stock having performed exceptionally well over the last five years, these patterns are being accounted for by investors. With that being said, we still think the promising fundamentals mean the company deserves some further due diligence.
On a final note, we've found 1 warning sign for Premier Investments that we think you should be aware of.
While Premier Investments isn't earning the highest return, check out this free list of companies that are earning high returns on equity with solid balance sheets.
Have feedback on this article? Concerned about the content? Get in touch with us directly. Alternatively, email editorial-team (at) simplywallst.com.
This article by Simply Wall St is general in nature. We provide commentary based on historical data and analyst forecasts only using an unbiased methodology and our articles are not intended to be financial advice. It does not constitute a recommendation to buy or sell any stock, and does not take account of your objectives, or your financial situation. We aim to bring you long-term focused analysis driven by fundamental data. Note that our analysis may not factor in the latest price-sensitive company announcements or qualitative material. Simply Wall St has no position in any stocks mentioned.
