
 Yahoo Finance
 Investors Shouldn't Overlook Capricorn Metals' (ASX:CMM) Impressive Returns On Capital
If you're looking for a multi-bagger, there's a few things to keep an eye out for. In a perfect world, we'd like to see a company investing more capital into its business and ideally the returns earned from that capital are also increasing. If you see this, it typically means it's a company with a great business model and plenty of profitable reinvestment opportunities. Speaking of which, we noticed some great changes in Capricorn Metals' (ASX:CMM) returns on capital, so let's have a look.
What Is Return On Capital Employed (ROCE)?
If you haven't worked with ROCE before, it measures the 'return' (pre-tax profit) a company generates from capital employed in its business. To calculate this metric for Capricorn Metals, this is the formula:
Return on Capital Employed = Earnings Before Interest and Tax (EBIT) ÷ (Total Assets - Current Liabilities)
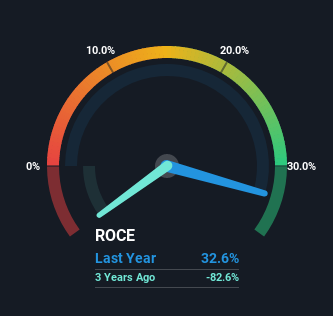
0.33 = AU$122m ÷ (AU$449m - AU$74m) (Based on the trailing twelve months to June 2022).
Thus, Capricorn Metals has an ROCE of 33%. That's a fantastic return and not only that, it outpaces the average of 10% earned by companies in a similar industry.
View our latest analysis for Capricorn Metals
In the above chart we have measured Capricorn Metals' prior ROCE against its prior performance, but the future is arguably more important. If you'd like to see what analysts are forecasting going forward, you should check out our free report for Capricorn Metals.
What Can We Tell From Capricorn Metals' ROCE Trend?
We're delighted to see that Capricorn Metals is reaping rewards from its investments and is now generating some pre-tax profits. The company was generating losses five years ago, but now it's earning 33% which is a sight for sore eyes. And unsurprisingly, like most companies trying to break into the black, Capricorn Metals is utilizing 1,124% more capital than it was five years ago. We like this trend, because it tells us the company has profitable reinvestment opportunities available to it, and if it continues going forward that can lead to a multi-bagger performance.
On a side note, we noticed that the improvement in ROCE appears to be partly fueled by an increase in current liabilities. The current liabilities has increased to 17% of total assets, so the business is now more funded by the likes of its suppliers or short-term creditors. It's worth keeping an eye on this because as the percentage of current liabilities to total assets increases, some aspects of risk also increase.
The Bottom Line On Capricorn Metals' ROCE
Overall, Capricorn Metals gets a big tick from us thanks in most part to the fact that it is now profitable and is reinvesting in its business. Since the stock has returned a staggering 818% to shareholders over the last five years, it looks like investors are recognizing these changes. Therefore, we think it would be worth your time to check if these trends are going to continue.
While Capricorn Metals looks impressive, no company is worth an infinite price. The intrinsic value infographic in our free research report helps visualize whether CMM is currently trading for a fair price.
High returns are a key ingredient to strong performance, so check out our free list ofstocks earning high returns on equity with solid balance sheets.
Have feedback on this article? Concerned about the content? Get in touch with us directly. Alternatively, email editorial-team (at) simplywallst.com.
This article by Simply Wall St is general in nature. We provide commentary based on historical data and analyst forecasts only using an unbiased methodology and our articles are not intended to be financial advice. It does not constitute a recommendation to buy or sell any stock, and does not take account of your objectives, or your financial situation. We aim to bring you long-term focused analysis driven by fundamental data. Note that our analysis may not factor in the latest price-sensitive company announcements or qualitative material. Simply Wall St has no position in any stocks mentioned.
Join A Paid User Research Session
You’ll receive a US$30 Amazon Gift card for 1 hour of your time while helping us build better investing tools for the individual investors like yourself. Sign up here
