
 Yahoo Finance
 Investors Shouldn't Overlook Avid Technology's (NASDAQ:AVID) Impressive Returns On Capital
There are a few key trends to look for if we want to identify the next multi-bagger. In a perfect world, we'd like to see a company investing more capital into its business and ideally the returns earned from that capital are also increasing. Ultimately, this demonstrates that it's a business that is reinvesting profits at increasing rates of return. And in light of that, the trends we're seeing at Avid Technology's (NASDAQ:AVID) look very promising so lets take a look.
Return On Capital Employed (ROCE): What Is It?
For those who don't know, ROCE is a measure of a company's yearly pre-tax profit (its return), relative to the capital employed in the business. To calculate this metric for Avid Technology, this is the formula:
Return on Capital Employed = Earnings Before Interest and Tax (EBIT) ÷ (Total Assets - Current Liabilities)
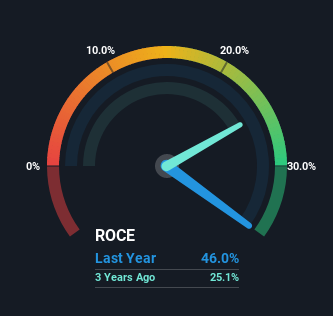
0.46 = US$45m ÷ (US$274m - US$177m) (Based on the trailing twelve months to March 2023).
So, Avid Technology has an ROCE of 46%. That's a fantastic return and not only that, it outpaces the average of 8.4% earned by companies in a similar industry.
See our latest analysis for Avid Technology
In the above chart we have measured Avid Technology's prior ROCE against its prior performance, but the future is arguably more important. If you'd like to see what analysts are forecasting going forward, you should check out our free report for Avid Technology.
What Does the ROCE Trend For Avid Technology Tell Us?
The trends we've noticed at Avid Technology are quite reassuring. The numbers show that in the last five years, the returns generated on capital employed have grown considerably to 46%. The company is effectively making more money per dollar of capital used, and it's worth noting that the amount of capital has increased too, by 67%. The increasing returns on a growing amount of capital is common amongst multi-baggers and that's why we're impressed.
One more thing to note, Avid Technology has decreased current liabilities to 65% of total assets over this period, which effectively reduces the amount of funding from suppliers or short-term creditors. So this improvement in ROCE has come from the business' underlying economics, which is great to see. Nevertheless, there are some potential risks the company is bearing with current liabilities that high, so just keep that in mind.
What We Can Learn From Avid Technology's ROCE
To sum it up, Avid Technology has proven it can reinvest in the business and generate higher returns on that capital employed, which is terrific. Since the stock has returned a staggering 329% to shareholders over the last five years, it looks like investors are recognizing these changes. Therefore, we think it would be worth your time to check if these trends are going to continue.
Avid Technology does have some risks, we noticed 2 warning signs (and 1 which shouldn't be ignored) we think you should know about.
If you'd like to see other companies earning high returns, check out our free list of companies earning high returns with solid balance sheets here.
Have feedback on this article? Concerned about the content? Get in touch with us directly. Alternatively, email editorial-team (at) simplywallst.com.
This article by Simply Wall St is general in nature. We provide commentary based on historical data and analyst forecasts only using an unbiased methodology and our articles are not intended to be financial advice. It does not constitute a recommendation to buy or sell any stock, and does not take account of your objectives, or your financial situation. We aim to bring you long-term focused analysis driven by fundamental data. Note that our analysis may not factor in the latest price-sensitive company announcements or qualitative material. Simply Wall St has no position in any stocks mentioned.
Join A Paid User Research Session
You’ll receive a US$30 Amazon Gift card for 1 hour of your time while helping us build better investing tools for the individual investors like yourself. Sign up here
