
 Yahoo Finance
 Investors in RedFlow (ASX:RFX) have made a impressive return of 161% over the past year
Unfortunately, investing is risky - companies can and do go bankrupt. But if you pick the right business to buy shares in, you can make more than you can lose. For example, the RedFlow Limited (ASX:RFX) share price had more than doubled in just one year - up 158%. Meanwhile the share price is 5.1% higher than it was a week ago. On the other hand, longer term shareholders have had a tougher run, with the stock falling 16% in three years.
So let's assess the underlying fundamentals over the last 1 year and see if they've moved in lock-step with shareholder returns.
See our latest analysis for RedFlow
RedFlow isn't currently profitable, so most analysts would look to revenue growth to get an idea of how fast the underlying business is growing. When a company doesn't make profits, we'd generally expect to see good revenue growth. As you can imagine, fast revenue growth, when maintained, often leads to fast profit growth.
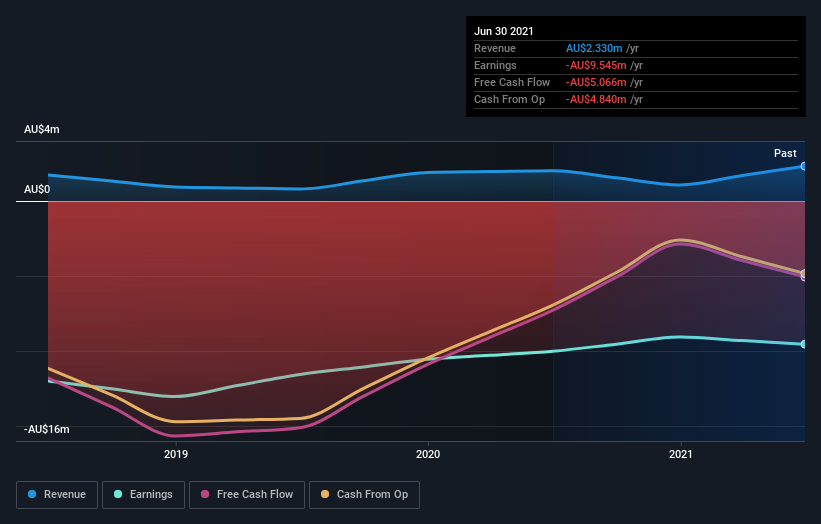
In the last year RedFlow saw its revenue grow by 15%. We respect that sort of growth, no doubt. While that revenue growth is pretty good the share price performance outshone it, with a lift of 158% as mentioned above. If the profitability is on the horizon then now could be a very exciting time to be a shareholder. Of course, we are always cautious about succumbing to 'fear of missing out' when a stock has shot up strongly.
You can see below how earnings and revenue have changed over time (discover the exact values by clicking on the image).
This free interactive report on RedFlow's balance sheet strength is a great place to start, if you want to investigate the stock further.
What about the Total Shareholder Return (TSR)?
We'd be remiss not to mention the difference between RedFlow's total shareholder return (TSR) and its share price return. The TSR attempts to capture the value of dividends (as if they were reinvested) as well as any spin-offs or discounted capital raisings offered to shareholders. RedFlow hasn't been paying dividends, but its TSR of 161% exceeds its share price return of 158%, implying it has either spun-off a business, or raised capital at a discount; thereby providing additional value to shareholders.
A Different Perspective
It's nice to see that RedFlow shareholders have received a total shareholder return of 161% over the last year. There's no doubt those recent returns are much better than the TSR loss of 13% per year over five years. This makes us a little wary, but the business might have turned around its fortunes. It's always interesting to track share price performance over the longer term. But to understand RedFlow better, we need to consider many other factors. Consider risks, for instance. Every company has them, and we've spotted 4 warning signs for RedFlow you should know about.
We will like RedFlow better if we see some big insider buys. While we wait, check out this free list of growing companies with considerable, recent, insider buying.
Please note, the market returns quoted in this article reflect the market weighted average returns of stocks that currently trade on AU exchanges.
This article by Simply Wall St is general in nature. We provide commentary based on historical data and analyst forecasts only using an unbiased methodology and our articles are not intended to be financial advice. It does not constitute a recommendation to buy or sell any stock, and does not take account of your objectives, or your financial situation. We aim to bring you long-term focused analysis driven by fundamental data. Note that our analysis may not factor in the latest price-sensitive company announcements or qualitative material. Simply Wall St has no position in any stocks mentioned.
Have feedback on this article? Concerned about the content? Get in touch with us directly. Alternatively, email editorial-team (at) simplywallst.com.
