
 Yahoo Finance
 Investors push Zendesk (NYSE:ZEN) 20% lower this week, company's increasing losses might be to blame
Zendesk, Inc. (NYSE:ZEN) shareholders might be concerned after seeing the share price drop 20% in the last week. But that scarcely detracts from the really solid long term returns generated by the company over five years. We think most investors would be happy with the 294% return, over that period. To some, the recent pullback wouldn't be surprising after such a fast rise. Ultimately business performance will determine whether the stock price continues the positive long term trend.
Although Zendesk has shed US$3.0b from its market cap this week, let's take a look at its longer term fundamental trends and see if they've driven returns.
Check out our latest analysis for Zendesk
Zendesk wasn't profitable in the last twelve months, it is unlikely we'll see a strong correlation between its share price and its earnings per share (EPS). Arguably revenue is our next best option. When a company doesn't make profits, we'd generally expect to see good revenue growth. Some companies are willing to postpone profitability to grow revenue faster, but in that case one does expect good top-line growth.
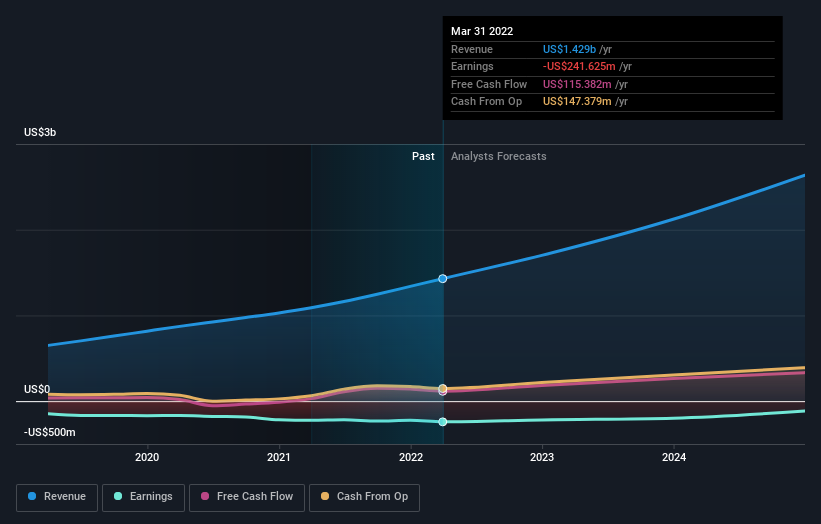
In the last 5 years Zendesk saw its revenue grow at 27% per year. Even measured against other revenue-focussed companies, that's a good result. Meanwhile, its share price performance certainly reflects the strong growth, given the share price grew at 32% per year, compound, during the period. So it seems likely that buyers have paid attention to the strong revenue growth. Zendesk seems like a high growth stock - so growth investors might want to add it to their watchlist.
You can see below how earnings and revenue have changed over time (discover the exact values by clicking on the image).
Zendesk is well known by investors, and plenty of clever analysts have tried to predict the future profit levels. Given we have quite a good number of analyst forecasts, it might be well worth checking out this free chart depicting consensus estimates.
A Different Perspective
While the broader market lost about 9.4% in the twelve months, Zendesk shareholders did even worse, losing 26%. However, it could simply be that the share price has been impacted by broader market jitters. It might be worth keeping an eye on the fundamentals, in case there's a good opportunity. On the bright side, long term shareholders have made money, with a gain of 32% per year over half a decade. If the fundamental data continues to indicate long term sustainable growth, the current sell-off could be an opportunity worth considering. While it is well worth considering the different impacts that market conditions can have on the share price, there are other factors that are even more important. Case in point: We've spotted 3 warning signs for Zendesk you should be aware of.
If you are like me, then you will not want to miss this free list of growing companies that insiders are buying.
Please note, the market returns quoted in this article reflect the market weighted average returns of stocks that currently trade on US exchanges.
Have feedback on this article? Concerned about the content? Get in touch with us directly. Alternatively, email editorial-team (at) simplywallst.com.
This article by Simply Wall St is general in nature. We provide commentary based on historical data and analyst forecasts only using an unbiased methodology and our articles are not intended to be financial advice. It does not constitute a recommendation to buy or sell any stock, and does not take account of your objectives, or your financial situation. We aim to bring you long-term focused analysis driven by fundamental data. Note that our analysis may not factor in the latest price-sensitive company announcements or qualitative material. Simply Wall St has no position in any stocks mentioned.
