
 Yahoo Finance
 Investors in Ocular Therapeutix (NASDAQ:OCUL) have unfortunately lost 63% over the last year
Investing in stocks comes with the risk that the share price will fall. Unfortunately, shareholders of Ocular Therapeutix, Inc. (NASDAQ:OCUL) have suffered share price declines over the last year. The share price is down a hefty 63% in that time. On the bright side, the stock is actually up 20% in the last three years. Even worse, it's down 30% in about a month, which isn't fun at all.
Now let's have a look at the company's fundamentals, and see if the long term shareholder return has matched the performance of the underlying business.
See our latest analysis for Ocular Therapeutix
Ocular Therapeutix wasn't profitable in the last twelve months, it is unlikely we'll see a strong correlation between its share price and its earnings per share (EPS). Arguably revenue is our next best option. Generally speaking, companies without profits are expected to grow revenue every year, and at a good clip. As you can imagine, fast revenue growth, when maintained, often leads to fast profit growth.
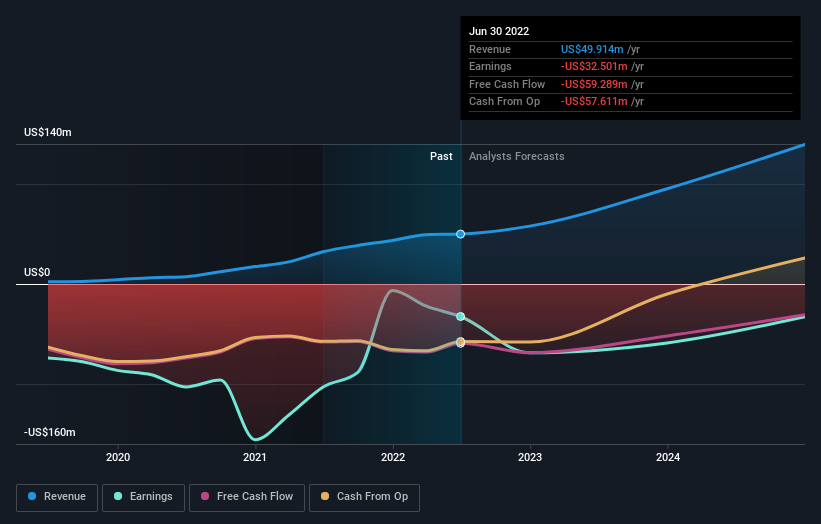
In the last year Ocular Therapeutix saw its revenue grow by 55%. That's a strong result which is better than most other loss making companies. Meanwhile, the share price slid 63%. This could mean hype has come out of the stock because the bottom line is concerning investors. Generally speaking investors would consider a stock like this less risky once it turns a profit. But when do you think that will happen?
You can see below how earnings and revenue have changed over time (discover the exact values by clicking on the image).
Balance sheet strength is crucial. It might be well worthwhile taking a look at our free report on how its financial position has changed over time.
A Different Perspective
While the broader market lost about 25% in the twelve months, Ocular Therapeutix shareholders did even worse, losing 63%. However, it could simply be that the share price has been impacted by broader market jitters. It might be worth keeping an eye on the fundamentals, in case there's a good opportunity. Regrettably, last year's performance caps off a bad run, with the shareholders facing a total loss of 5% per year over five years. Generally speaking long term share price weakness can be a bad sign, though contrarian investors might want to research the stock in hope of a turnaround. While it is well worth considering the different impacts that market conditions can have on the share price, there are other factors that are even more important. Case in point: We've spotted 2 warning signs for Ocular Therapeutix you should be aware of.
For those who like to find winning investments this free list of growing companies with recent insider purchasing, could be just the ticket.
Please note, the market returns quoted in this article reflect the market weighted average returns of stocks that currently trade on US exchanges.
Have feedback on this article? Concerned about the content? Get in touch with us directly. Alternatively, email editorial-team (at) simplywallst.com.
This article by Simply Wall St is general in nature. We provide commentary based on historical data and analyst forecasts only using an unbiased methodology and our articles are not intended to be financial advice. It does not constitute a recommendation to buy or sell any stock, and does not take account of your objectives, or your financial situation. We aim to bring you long-term focused analysis driven by fundamental data. Note that our analysis may not factor in the latest price-sensitive company announcements or qualitative material. Simply Wall St has no position in any stocks mentioned.
Join A Paid User Research Session
You’ll receive a US$30 Amazon Gift card for 1 hour of your time while helping us build better investing tools for the individual investors like yourself. Sign up here
