
 Yahoo Finance
 Investors Met With Slowing Returns on Capital At Yellow Pages (TSE:Y)
Finding a business that has the potential to grow substantially is not easy, but it is possible if we look at a few key financial metrics. Typically, we'll want to notice a trend of growing return on capital employed (ROCE) and alongside that, an expanding base of capital employed. If you see this, it typically means it's a company with a great business model and plenty of profitable reinvestment opportunities. Having said that, while the ROCE is currently high for Yellow Pages (TSE:Y), we aren't jumping out of our chairs because returns are decreasing.
Return On Capital Employed (ROCE): What Is It?
For those who don't know, ROCE is a measure of a company's yearly pre-tax profit (its return), relative to the capital employed in the business. Analysts use this formula to calculate it for Yellow Pages:
Return on Capital Employed = Earnings Before Interest and Tax (EBIT) ÷ (Total Assets - Current Liabilities)
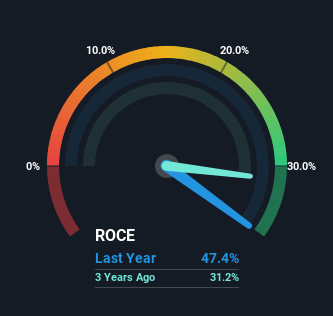
0.47 = CA$56m ÷ (CA$157m - CA$40m) (Based on the trailing twelve months to March 2024).
Therefore, Yellow Pages has an ROCE of 47%. In absolute terms that's a great return and it's even better than the Interactive Media and Services industry average of 6.4%.
Check out our latest analysis for Yellow Pages
In the above chart we have measured Yellow Pages' prior ROCE against its prior performance, but the future is arguably more important. If you'd like to see what analysts are forecasting going forward, you should check out our free analyst report for Yellow Pages .
What Does the ROCE Trend For Yellow Pages Tell Us?
Over the past five years, Yellow Pages' ROCE has remained relatively flat while the business is using 56% less capital than before. To us that doesn't look like a multi-bagger because the company appears to be selling assets and it's returns aren't increasing. However, the business's operational efficiency is still impressive considering the ROCE is high in absolute terms.
One more thing to note, even though ROCE has remained relatively flat over the last five years, the reduction in current liabilities to 25% of total assets, is good to see from a business owner's perspective. This can eliminate some of the risks inherent in the operations because the business has less outstanding obligations to their suppliers and or short-term creditors than they did previously.
In Conclusion...
Overall, we're not ecstatic to see Yellow Pages reducing the amount of capital it employs in the business. And with the stock having returned a mere 37% in the last five years to shareholders, you could argue that they're aware of these lackluster trends. So if you're looking for a multi-bagger, the underlying trends indicate you may have better chances elsewhere.
One final note, you should learn about the 4 warning signs we've spotted with Yellow Pages (including 1 which doesn't sit too well with us) .
Yellow Pages is not the only stock earning high returns. If you'd like to see more, check out our free list of companies earning high returns on equity with solid fundamentals.
Have feedback on this article? Concerned about the content? Get in touch with us directly. Alternatively, email editorial-team (at) simplywallst.com.
This article by Simply Wall St is general in nature. We provide commentary based on historical data and analyst forecasts only using an unbiased methodology and our articles are not intended to be financial advice. It does not constitute a recommendation to buy or sell any stock, and does not take account of your objectives, or your financial situation. We aim to bring you long-term focused analysis driven by fundamental data. Note that our analysis may not factor in the latest price-sensitive company announcements or qualitative material. Simply Wall St has no position in any stocks mentioned.
