
 Yahoo Finance
 Some Investors May Be Worried About Duke Energy's (NYSE:DUK) Returns On Capital
To find a multi-bagger stock, what are the underlying trends we should look for in a business? One common approach is to try and find a company with returns on capital employed (ROCE) that are increasing, in conjunction with a growing amount of capital employed. If you see this, it typically means it's a company with a great business model and plenty of profitable reinvestment opportunities. Having said that, from a first glance at Duke Energy (NYSE:DUK) we aren't jumping out of our chairs at how returns are trending, but let's have a deeper look.
Understanding Return On Capital Employed (ROCE)
Just to clarify if you're unsure, ROCE is a metric for evaluating how much pre-tax income (in percentage terms) a company earns on the capital invested in its business. To calculate this metric for Duke Energy, this is the formula:
Return on Capital Employed = Earnings Before Interest and Tax (EBIT) ÷ (Total Assets - Current Liabilities)
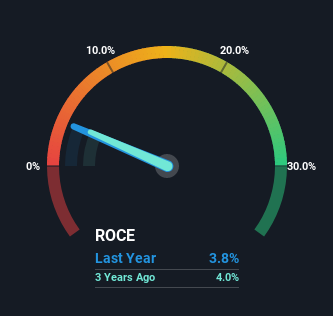
0.038 = US$6.1b ÷ (US$176b - US$17b) (Based on the trailing twelve months to September 2022).
Thus, Duke Energy has an ROCE of 3.8%. In absolute terms, that's a low return but it's around the Electric Utilities industry average of 4.6%.
See our latest analysis for Duke Energy
Above you can see how the current ROCE for Duke Energy compares to its prior returns on capital, but there's only so much you can tell from the past. If you'd like, you can check out the forecasts from the analysts covering Duke Energy here for free.
How Are Returns Trending?
In terms of Duke Energy's historical ROCE movements, the trend isn't fantastic. To be more specific, ROCE has fallen from 5.0% over the last five years. However, given capital employed and revenue have both increased it appears that the business is currently pursuing growth, at the consequence of short term returns. If these investments prove successful, this can bode very well for long term stock performance.
The Bottom Line
Even though returns on capital have fallen in the short term, we find it promising that revenue and capital employed have both increased for Duke Energy. And the stock has followed suit returning a meaningful 41% to shareholders over the last five years. So while investors seem to be recognizing these promising trends, we would look further into this stock to make sure the other metrics justify the positive view.
Duke Energy does have some risks, we noticed 3 warning signs (and 1 which can't be ignored) we think you should know about.
While Duke Energy may not currently earn the highest returns, we've compiled a list of companies that currently earn more than 25% return on equity. Check out this free list here.
Have feedback on this article? Concerned about the content? Get in touch with us directly. Alternatively, email editorial-team (at) simplywallst.com.
This article by Simply Wall St is general in nature. We provide commentary based on historical data and analyst forecasts only using an unbiased methodology and our articles are not intended to be financial advice. It does not constitute a recommendation to buy or sell any stock, and does not take account of your objectives, or your financial situation. We aim to bring you long-term focused analysis driven by fundamental data. Note that our analysis may not factor in the latest price-sensitive company announcements or qualitative material. Simply Wall St has no position in any stocks mentioned.
Join A Paid User Research Session
You’ll receive a US$30 Amazon Gift card for 1 hour of your time while helping us build better investing tools for the individual investors like yourself. Sign up here
