
 Yahoo Finance
 Some Investors May Be Worried About Auction Technology Group's (LON:ATG) Returns On Capital
Did you know there are some financial metrics that can provide clues of a potential multi-bagger? Ideally, a business will show two trends; firstly a growing return on capital employed (ROCE) and secondly, an increasing amount of capital employed. This shows us that it's a compounding machine, able to continually reinvest its earnings back into the business and generate higher returns. However, after briefly looking over the numbers, we don't think Auction Technology Group (LON:ATG) has the makings of a multi-bagger going forward, but let's have a look at why that may be.
Return On Capital Employed (ROCE): What Is It?
Just to clarify if you're unsure, ROCE is a metric for evaluating how much pre-tax income (in percentage terms) a company earns on the capital invested in its business. To calculate this metric for Auction Technology Group, this is the formula:
Return on Capital Employed = Earnings Before Interest and Tax (EBIT) ÷ (Total Assets - Current Liabilities)
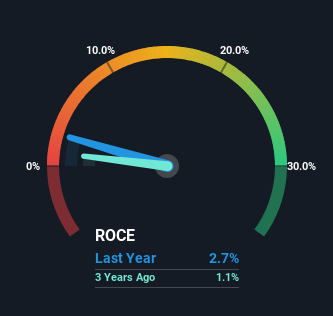
0.027 = UK£23m ÷ (UK£872m - UK£39m) (Based on the trailing twelve months to March 2024).
Therefore, Auction Technology Group has an ROCE of 2.7%. In absolute terms, that's a low return and it also under-performs the Consumer Services industry average of 12%.
View our latest analysis for Auction Technology Group
In the above chart we have measured Auction Technology Group's prior ROCE against its prior performance, but the future is arguably more important. If you're interested, you can view the analysts predictions in our free analyst report for Auction Technology Group .
What Can We Tell From Auction Technology Group's ROCE Trend?
On the surface, the trend of ROCE at Auction Technology Group doesn't inspire confidence. To be more specific, ROCE has fallen from 14% over the last five years. On the other hand, the company has been employing more capital without a corresponding improvement in sales in the last year, which could suggest these investments are longer term plays. It may take some time before the company starts to see any change in earnings from these investments.
On a related note, Auction Technology Group has decreased its current liabilities to 4.5% of total assets. So we could link some of this to the decrease in ROCE. Effectively this means their suppliers or short-term creditors are funding less of the business, which reduces some elements of risk. Since the business is basically funding more of its operations with it's own money, you could argue this has made the business less efficient at generating ROCE.
The Key Takeaway
To conclude, we've found that Auction Technology Group is reinvesting in the business, but returns have been falling. And investors appear hesitant that the trends will pick up because the stock has fallen 56% in the last three years. Therefore based on the analysis done in this article, we don't think Auction Technology Group has the makings of a multi-bagger.
If you want to continue researching Auction Technology Group, you might be interested to know about the 1 warning sign that our analysis has discovered.
For those who like to invest in solid companies, check out this free list of companies with solid balance sheets and high returns on equity.
Have feedback on this article? Concerned about the content? Get in touch with us directly. Alternatively, email editorial-team (at) simplywallst.com.
This article by Simply Wall St is general in nature. We provide commentary based on historical data and analyst forecasts only using an unbiased methodology and our articles are not intended to be financial advice. It does not constitute a recommendation to buy or sell any stock, and does not take account of your objectives, or your financial situation. We aim to bring you long-term focused analysis driven by fundamental data. Note that our analysis may not factor in the latest price-sensitive company announcements or qualitative material. Simply Wall St has no position in any stocks mentioned.
