
 Yahoo Finance
 Investors in Koninklijke KPN (AMS:KPN) have made a return of 29% over the past three years
Low-cost index funds make it easy to achieve average market returns. But in any diversified portfolio of stocks, you'll see some that fall short of the average. That's what has happened with the Koninklijke KPN N.V. (AMS:KPN) share price. It's up 12% over three years, but that is below the market return. Zooming in, the stock is up a respectable 7.9% in the last year.
Now it's worth having a look at the company's fundamentals too, because that will help us determine if the long term shareholder return has matched the performance of the underlying business.
Check out our latest analysis for Koninklijke KPN
To paraphrase Benjamin Graham: Over the short term the market is a voting machine, but over the long term it's a weighing machine. By comparing earnings per share (EPS) and share price changes over time, we can get a feel for how investor attitudes to a company have morphed over time.
Koninklijke KPN was able to grow its EPS at 18% per year over three years, sending the share price higher. This EPS growth is higher than the 4% average annual increase in the share price. So one could reasonably conclude that the market has cooled on the stock.
The image below shows how EPS has tracked over time (if you click on the image you can see greater detail).
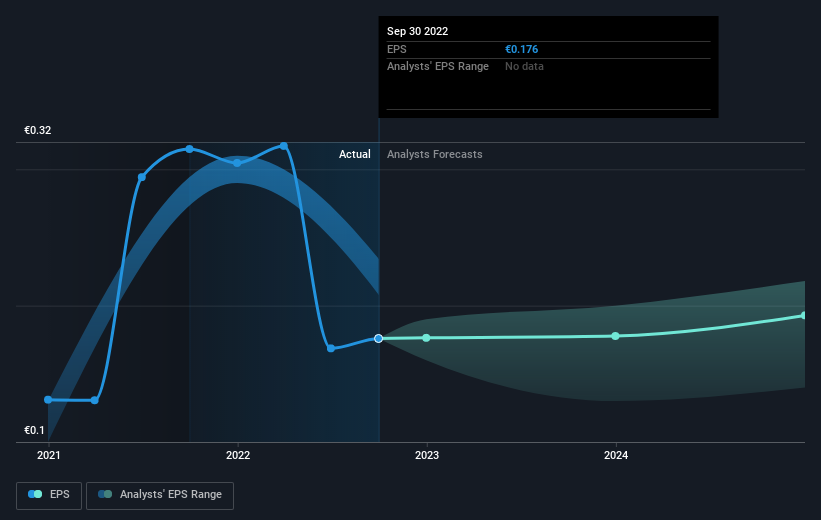
This free interactive report on Koninklijke KPN's earnings, revenue and cash flow is a great place to start, if you want to investigate the stock further.
What About Dividends?
It is important to consider the total shareholder return, as well as the share price return, for any given stock. Whereas the share price return only reflects the change in the share price, the TSR includes the value of dividends (assuming they were reinvested) and the benefit of any discounted capital raising or spin-off. Arguably, the TSR gives a more comprehensive picture of the return generated by a stock. As it happens, Koninklijke KPN's TSR for the last 3 years was 29%, which exceeds the share price return mentioned earlier. The dividends paid by the company have thusly boosted the total shareholder return.
A Different Perspective
We're pleased to report that Koninklijke KPN shareholders have received a total shareholder return of 12% over one year. Of course, that includes the dividend. That's better than the annualised return of 5% over half a decade, implying that the company is doing better recently. Given the share price momentum remains strong, it might be worth taking a closer look at the stock, lest you miss an opportunity. I find it very interesting to look at share price over the long term as a proxy for business performance. But to truly gain insight, we need to consider other information, too. Even so, be aware that Koninklijke KPN is showing 3 warning signs in our investment analysis , you should know about...
If you like to buy stocks alongside management, then you might just love this free list of companies. (Hint: insiders have been buying them).
Please note, the market returns quoted in this article reflect the market weighted average returns of stocks that currently trade on NL exchanges.
Have feedback on this article? Concerned about the content? Get in touch with us directly. Alternatively, email editorial-team (at) simplywallst.com.
This article by Simply Wall St is general in nature. We provide commentary based on historical data and analyst forecasts only using an unbiased methodology and our articles are not intended to be financial advice. It does not constitute a recommendation to buy or sell any stock, and does not take account of your objectives, or your financial situation. We aim to bring you long-term focused analysis driven by fundamental data. Note that our analysis may not factor in the latest price-sensitive company announcements or qualitative material. Simply Wall St has no position in any stocks mentioned.
Join A Paid User Research Session
You’ll receive a US$30 Amazon Gift card for 1 hour of your time while helping us build better investing tools for the individual investors like yourself. Sign up here
