
 Yahoo Finance
 What Investors Should Know About Zenith Energy Limited’s (ASX:ZEN) Financial Strength
Want to participate in a short research study? Help shape the future of investing tools and receive a $20 prize!
While small-cap stocks, such as Zenith Energy Limited (ASX:ZEN) with its market cap of AU$68m, are popular for their explosive growth, investors should also be aware of their balance sheet to judge whether the company can survive a downturn. So, understanding the company’s financial health becomes vital, since poor capital management may bring about bankruptcies, which occur at a higher rate for small-caps. I believe these basic checks tell most of the story you need to know. However, this commentary is still very high-level, so I recommend you dig deeper yourself into ZEN here.
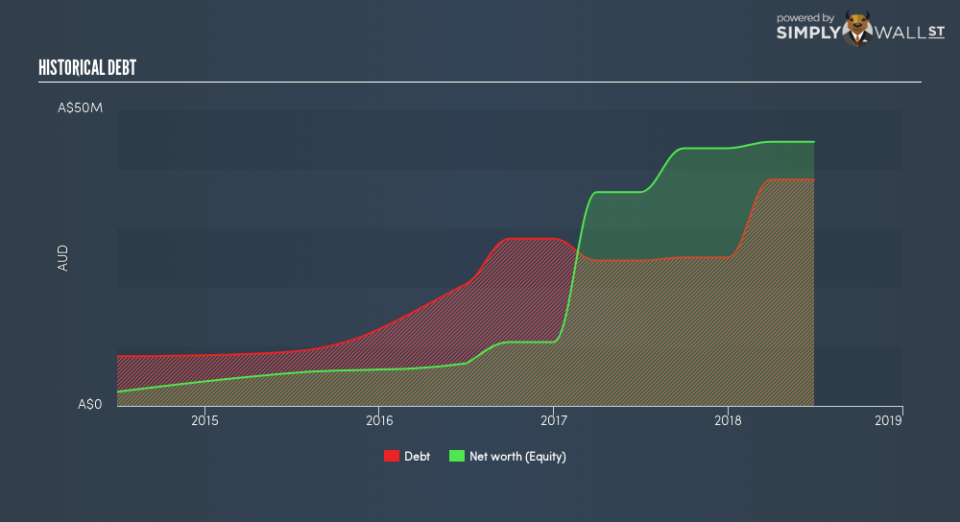
How does ZEN’s operating cash flow stack up against its debt?
ZEN has built up its total debt levels in the last twelve months, from AU$25m to AU$38m – this includes long-term debt. With this growth in debt, ZEN currently has AU$2.0m remaining in cash and short-term investments , ready to deploy into the business. Additionally, ZEN has generated AU$6.9m in operating cash flow in the last twelve months, resulting in an operating cash to total debt ratio of 18%, signalling that ZEN’s debt is not appropriately covered by operating cash. This ratio can also be interpreted as a measure of efficiency as an alternative to return on assets. In ZEN’s case, it is able to generate 0.18x cash from its debt capital.
Can ZEN pay its short-term liabilities?
Looking at ZEN’s AU$19m in current liabilities, it seems that the business arguably has a rather low level of current assets relative its obligations, with the current ratio last standing at 0.94x.
Does ZEN face the risk of succumbing to its debt-load?
With a debt-to-equity ratio of 86%, ZEN can be considered as an above-average leveraged company. This is not unusual for small-caps as debt tends to be a cheaper and faster source of funding for some businesses. We can test if ZEN’s debt levels are sustainable by measuring interest payments against earnings of a company. Ideally, earnings before interest and tax (EBIT) should cover net interest by at least three times. For ZEN, the ratio of 7.37x suggests that interest is appropriately covered, which means that lenders may be less hesitant to lend out more funding as ZEN’s high interest coverage is seen as responsible and safe practice.
Next Steps:
Although ZEN’s debt level is towards the higher end of the spectrum, its cash flow coverage seems adequate to meet debt obligations which means its debt is being efficiently utilised. However, its lack of liquidity raises questions over current asset management practices for the small-cap. Keep in mind I haven’t considered other factors such as how ZEN has been performing in the past. You should continue to research Zenith Energy to get a better picture of the stock by looking at:
Future Outlook: What are well-informed industry analysts predicting for ZEN’s future growth? Take a look at our free research report of analyst consensus for ZEN’s outlook.
Historical Performance: What has ZEN’s returns been like over the past? Go into more detail in the past track record analysis and take a look at the free visual representations of our analysis for more clarity.
Other High-Performing Stocks: Are there other stocks that provide better prospects with proven track records? Explore our free list of these great stocks here.
We aim to bring you long-term focused research analysis driven by fundamental data. Note that our analysis may not factor in the latest price-sensitive company announcements or qualitative material.
If you spot an error that warrants correction, please contact the editor at editorial-team@simplywallst.com. This article by Simply Wall St is general in nature. It does not constitute a recommendation to buy or sell any stock, and does not take account of your objectives, or your financial situation. Simply Wall St has no position in the stocks mentioned. Thank you for reading.
