
 Yahoo Finance
 Investors in Healius (ASX:HLS) have made a decent return of 48% over the past three years
One simple way to benefit from the stock market is to buy an index fund. But if you choose individual stocks with prowess, you can make superior returns. Just take a look at Healius Limited (ASX:HLS), which is up 37%, over three years, soundly beating the market return of 20% (not including dividends). On the other hand, the returns haven't been quite so good recently, with shareholders up just 9.8% , including dividends .
So let's investigate and see if the longer term performance of the company has been in line with the underlying business' progress.
Check out our latest analysis for Healius
There is no denying that markets are sometimes efficient, but prices do not always reflect underlying business performance. One flawed but reasonable way to assess how sentiment around a company has changed is to compare the earnings per share (EPS) with the share price.
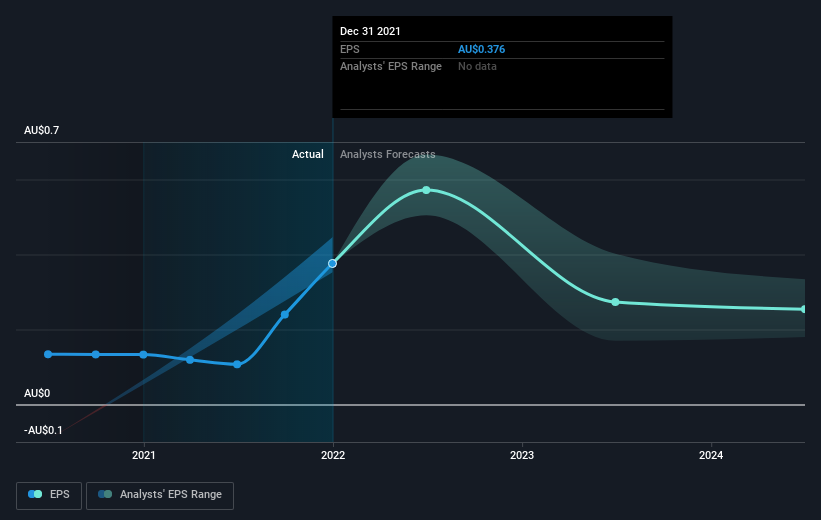
Healius was able to grow its EPS at 349% per year over three years, sending the share price higher. This EPS growth is higher than the 11% average annual increase in the share price. So one could reasonably conclude that the market has cooled on the stock. We'd venture the lowish P/E ratio of 11.07 also reflects the negative sentiment around the stock.
The company's earnings per share (over time) is depicted in the image below (click to see the exact numbers).
We know that Healius has improved its bottom line over the last three years, but what does the future have in store? Take a more thorough look at Healius' financial health with this free report on its balance sheet.
What About Dividends?
As well as measuring the share price return, investors should also consider the total shareholder return (TSR). Whereas the share price return only reflects the change in the share price, the TSR includes the value of dividends (assuming they were reinvested) and the benefit of any discounted capital raising or spin-off. It's fair to say that the TSR gives a more complete picture for stocks that pay a dividend. As it happens, Healius' TSR for the last 3 years was 48%, which exceeds the share price return mentioned earlier. And there's no prize for guessing that the dividend payments largely explain the divergence!
A Different Perspective
It's good to see that Healius has rewarded shareholders with a total shareholder return of 9.8% in the last twelve months. Of course, that includes the dividend. That's better than the annualised return of 6% over half a decade, implying that the company is doing better recently. Someone with an optimistic perspective could view the recent improvement in TSR as indicating that the business itself is getting better with time. It's always interesting to track share price performance over the longer term. But to understand Healius better, we need to consider many other factors. To that end, you should learn about the 2 warning signs we've spotted with Healius (including 1 which is a bit unpleasant) .
If you would prefer to check out another company -- one with potentially superior financials -- then do not miss this free list of companies that have proven they can grow earnings.
Please note, the market returns quoted in this article reflect the market weighted average returns of stocks that currently trade on AU exchanges.
Have feedback on this article? Concerned about the content? Get in touch with us directly. Alternatively, email editorial-team (at) simplywallst.com.
This article by Simply Wall St is general in nature. We provide commentary based on historical data and analyst forecasts only using an unbiased methodology and our articles are not intended to be financial advice. It does not constitute a recommendation to buy or sell any stock, and does not take account of your objectives, or your financial situation. We aim to bring you long-term focused analysis driven by fundamental data. Note that our analysis may not factor in the latest price-sensitive company announcements or qualitative material. Simply Wall St has no position in any stocks mentioned.
