
 Yahoo Finance
 Investors In Fletcher Building Limited (NZSE:FBU) Should Consider This, First

Dividend paying stocks like Fletcher Building Limited (NZSE:FBU) tend to be popular with investors, and for good reason - some research suggests a significant amount of all stock market returns come from reinvested dividends. Yet sometimes, investors buy a stock for its dividend and lose money because the share price falls by more than they earned in dividend payments.
In this case, Fletcher Building likely looks attractive to investors, given its 5.7% dividend yield and a payment history of over ten years. We'd guess that plenty of investors have purchased it for the income. There are a few simple ways to reduce the risks of buying Fletcher Building for its dividend, and we'll go through these below.
Explore this interactive chart for our latest analysis on Fletcher Building!
Payout ratios
Dividends are usually paid out of company earnings. If a company is paying more than it earns, then the dividend might become unsustainable - hardly an ideal situation. Comparing dividend payments to a company's net profit after tax is a simple way of reality-checking whether a dividend is sustainable. In the last year, Fletcher Building paid out 80% of its profit as dividends. It's paying out most of its earnings, which limits the amount that can be reinvested in the business. This may indicate limited need for further capital within the business, or highlight a commitment to paying a dividend.
In addition to comparing dividends against profits, we should inspect whether the company generated enough cash to pay its dividend. Unfortunately, while Fletcher Building pays a dividend, it also reported negative free cash flow last year. While there may be a good reason for this, it's not ideal from a dividend perspective.
We update our data on Fletcher Building every 24 hours, so you can always get our latest analysis of its financial health, here.
Dividend Volatility
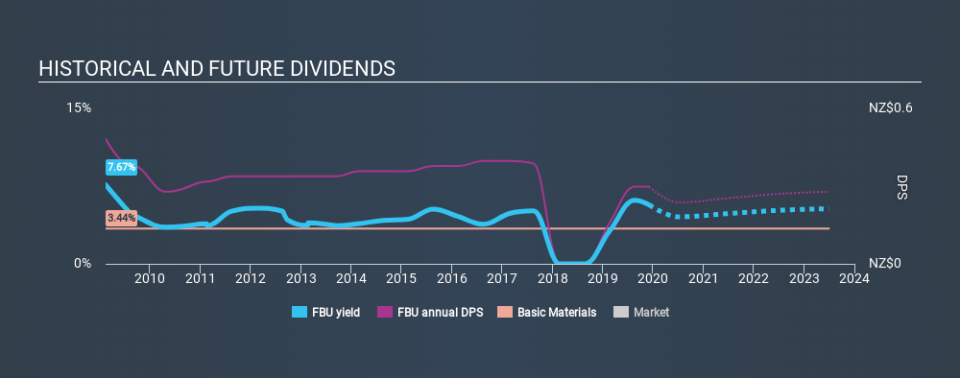
From the perspective of an income investor who wants to earn dividends for many years, there is not much point buying a stock if its dividend is regularly cut or is not reliable. Fletcher Building has been paying dividends for a long time, but for the purpose of this analysis, we only examine the past 10 years of payments. The dividend has been cut by more than 20% on at least one occasion historically. During the past ten-year period, the first annual payment was NZ$0.48 in 2009, compared to NZ$0.30 last year. This works out to be a decline of approximately 4.7% per year over that time. Fletcher Building's dividend has been cut sharply at least once, so it hasn't fallen by 4.7% every year, but this is a decent approximation of the long term change.
When a company's per-share dividend falls we question if this reflects poorly on either external business conditions, or the company's capital allocation decisions. Either way, we find it hard to get excited about a company with a declining dividend.
Dividend Growth Potential
Given that the dividend has been cut in the past, we need to check if earnings are growing and if that might lead to stronger dividends in the future. Over the past five years, it looks as though Fletcher Building's EPS have declined at around 10% a year. A sharp decline in earnings per share is not great from from a dividend perspective, as even conservative payout ratios can come under pressure if earnings fall far enough.
We'd also point out that Fletcher Building issued a meaningful number of new shares in the past year. Trying to grow the dividend when issuing new shares reminds us of the ancient Greek tale of Sisyphus - perpetually pushing a boulder uphill. Companies that consistently issue new shares are often suboptimal from a dividend perspective.
Conclusion
When we look at a dividend stock, we need to form a judgement on whether the dividend will grow, if the company is able to maintain it in a wide range of economic circumstances, and if the dividend payout is sustainable. First, the company has a payout ratio that was within an average range for most dividend stocks, but it paid out virtually all of its generated cash flow. Second, earnings per share have been in decline, and its dividend has been cut at least once in the past. There are a few too many issues for us to get comfortable with Fletcher Building from a dividend perspective. Businesses can change, but we would struggle to identify why an investor should rely on this stock for their income.
Given that earnings are not growing, the dividend does not look nearly so attractive. Businesses can change though, and we think it would make sense to see what analysts are forecasting for the company.
We have also put together a list of global stocks with a market capitalisation above $1bn and yielding more 3%.
If you spot an error that warrants correction, please contact the editor at editorial-team@simplywallst.com. This article by Simply Wall St is general in nature. It does not constitute a recommendation to buy or sell any stock, and does not take account of your objectives, or your financial situation. Simply Wall St has no position in the stocks mentioned.
We aim to bring you long-term focused research analysis driven by fundamental data. Note that our analysis may not factor in the latest price-sensitive company announcements or qualitative material. Thank you for reading.
