
 Yahoo Finance
 Investors five-year losses continue as ASOS (LON:ASC) dips a further 23% this week, earnings continue to decline
Long term investing works well, but it doesn't always work for each individual stock. We don't wish catastrophic capital loss on anyone. Spare a thought for those who held ASOS Plc (LON:ASC) for five whole years - as the share price tanked 87%. And we doubt long term believers are the only worried holders, since the stock price has declined 81% over the last twelve months. Shareholders have had an even rougher run lately, with the share price down 45% in the last 90 days. While a drop like that is definitely a body blow, money isn't as important as health and happiness.
Given the past week has been tough on shareholders, let's investigate the fundamentals and see what we can learn.
View our latest analysis for ASOS
To quote Buffett, 'Ships will sail around the world but the Flat Earth Society will flourish. There will continue to be wide discrepancies between price and value in the marketplace...' One way to examine how market sentiment has changed over time is to look at the interaction between a company's share price and its earnings per share (EPS).
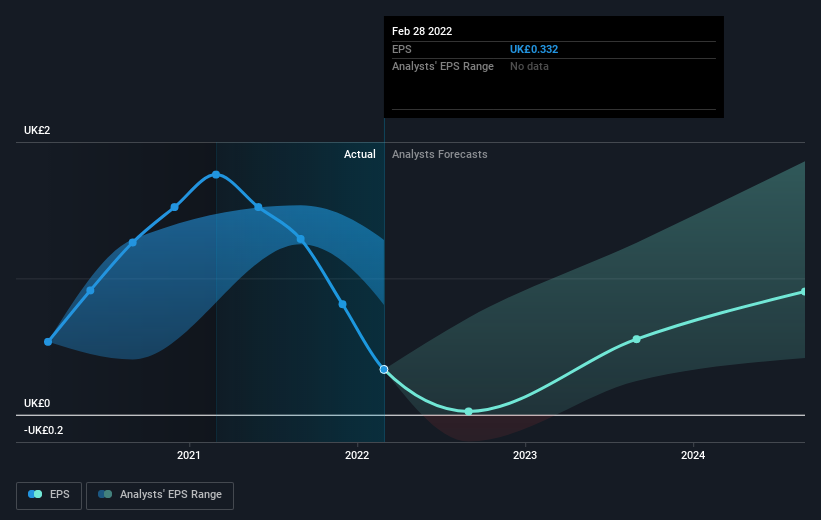
Looking back five years, both ASOS' share price and EPS declined; the latter at a rate of 6.1% per year. This reduction in EPS is less than the 34% annual reduction in the share price. This implies that the market was previously too optimistic about the stock.
You can see how EPS has changed over time in the image below (click on the chart to see the exact values).
It's probably worth noting we've seen significant insider buying in the last quarter, which we consider a positive. That said, we think earnings and revenue growth trends are even more important factors to consider. It might be well worthwhile taking a look at our free report on ASOS' earnings, revenue and cash flow.
A Different Perspective
While the broader market lost about 4.1% in the twelve months, ASOS shareholders did even worse, losing 81%. Having said that, it's inevitable that some stocks will be oversold in a falling market. The key is to keep your eyes on the fundamental developments. Regrettably, last year's performance caps off a bad run, with the shareholders facing a total loss of 13% per year over five years. We realise that Baron Rothschild has said investors should "buy when there is blood on the streets", but we caution that investors should first be sure they are buying a high quality business. I find it very interesting to look at share price over the long term as a proxy for business performance. But to truly gain insight, we need to consider other information, too. Take risks, for example - ASOS has 2 warning signs (and 1 which is a bit unpleasant) we think you should know about.
If you like to buy stocks alongside management, then you might just love this free list of companies. (Hint: insiders have been buying them).
Please note, the market returns quoted in this article reflect the market weighted average returns of stocks that currently trade on GB exchanges.
Have feedback on this article? Concerned about the content? Get in touch with us directly. Alternatively, email editorial-team (at) simplywallst.com.
This article by Simply Wall St is general in nature. We provide commentary based on historical data and analyst forecasts only using an unbiased methodology and our articles are not intended to be financial advice. It does not constitute a recommendation to buy or sell any stock, and does not take account of your objectives, or your financial situation. We aim to bring you long-term focused analysis driven by fundamental data. Note that our analysis may not factor in the latest price-sensitive company announcements or qualitative material. Simply Wall St has no position in any stocks mentioned.
Join A Paid User Research Session
You’ll receive a US$30 Amazon Gift card for 1 hour of your time while helping us build better investing tools for the individual investors like yourself. Sign up here
