
 Yahoo Finance
 Investors Could Be Concerned With Tactile Systems Technology's (NASDAQ:TCMD) Returns On Capital
If we want to find a potential multi-bagger, often there are underlying trends that can provide clues. Firstly, we'd want to identify a growing return on capital employed (ROCE) and then alongside that, an ever-increasing base of capital employed. Put simply, these types of businesses are compounding machines, meaning they are continually reinvesting their earnings at ever-higher rates of return. However, after briefly looking over the numbers, we don't think Tactile Systems Technology (NASDAQ:TCMD) has the makings of a multi-bagger going forward, but let's have a look at why that may be.
Return On Capital Employed (ROCE): What is it?
Just to clarify if you're unsure, ROCE is a metric for evaluating how much pre-tax income (in percentage terms) a company earns on the capital invested in its business. Analysts use this formula to calculate it for Tactile Systems Technology:
Return on Capital Employed = Earnings Before Interest and Tax (EBIT) ÷ (Total Assets - Current Liabilities)
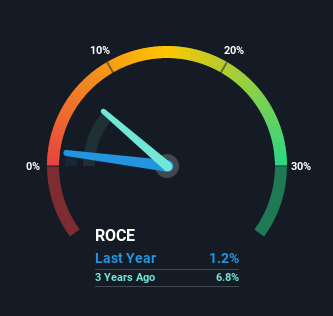
0.012 = US$2.7m ÷ (US$249m - US$31m) (Based on the trailing twelve months to September 2021).
Thus, Tactile Systems Technology has an ROCE of 1.2%. In absolute terms, that's a low return and it also under-performs the Medical Equipment industry average of 8.2%.
Check out our latest analysis for Tactile Systems Technology
Above you can see how the current ROCE for Tactile Systems Technology compares to its prior returns on capital, but there's only so much you can tell from the past. If you'd like to see what analysts are forecasting going forward, you should check out our free report for Tactile Systems Technology.
How Are Returns Trending?
On the surface, the trend of ROCE at Tactile Systems Technology doesn't inspire confidence. To be more specific, ROCE has fallen from 7.5% over the last five years. Although, given both revenue and the amount of assets employed in the business have increased, it could suggest the company is investing in growth, and the extra capital has led to a short-term reduction in ROCE. If these investments prove successful, this can bode very well for long term stock performance.
The Bottom Line
In summary, despite lower returns in the short term, we're encouraged to see that Tactile Systems Technology is reinvesting for growth and has higher sales as a result. These trends are starting to be recognized by investors since the stock has delivered a 31% gain to shareholders who've held over the last five years. Therefore we'd recommend looking further into this stock to confirm if it has the makings of a good investment.
One more thing to note, we've identified 2 warning signs with Tactile Systems Technology and understanding them should be part of your investment process.
While Tactile Systems Technology may not currently earn the highest returns, we've compiled a list of companies that currently earn more than 25% return on equity. Check out this free list here.
Have feedback on this article? Concerned about the content? Get in touch with us directly. Alternatively, email editorial-team (at) simplywallst.com.
This article by Simply Wall St is general in nature. We provide commentary based on historical data and analyst forecasts only using an unbiased methodology and our articles are not intended to be financial advice. It does not constitute a recommendation to buy or sell any stock, and does not take account of your objectives, or your financial situation. We aim to bring you long-term focused analysis driven by fundamental data. Note that our analysis may not factor in the latest price-sensitive company announcements or qualitative material. Simply Wall St has no position in any stocks mentioned.
