
 Yahoo Finance
 Investors Could Be Concerned With SEEK's (ASX:SEK) Returns On Capital
Finding a business that has the potential to grow substantially is not easy, but it is possible if we look at a few key financial metrics. Firstly, we'll want to see a proven return on capital employed (ROCE) that is increasing, and secondly, an expanding base of capital employed. Basically this means that a company has profitable initiatives that it can continue to reinvest in, which is a trait of a compounding machine. However, after briefly looking over the numbers, we don't think SEEK (ASX:SEK) has the makings of a multi-bagger going forward, but let's have a look at why that may be.
Understanding Return On Capital Employed (ROCE)
For those who don't know, ROCE is a measure of a company's yearly pre-tax profit (its return), relative to the capital employed in the business. The formula for this calculation on SEEK is:
Return on Capital Employed = Earnings Before Interest and Tax (EBIT) ÷ (Total Assets - Current Liabilities)
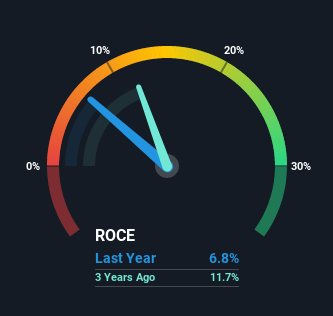
0.068 = AU$227m ÷ (AU$4.6b - AU$1.3b) (Based on the trailing twelve months to June 2021).
Thus, SEEK has an ROCE of 6.8%. In absolute terms, that's a low return and it also under-performs the Interactive Media and Services industry average of 16%.
See our latest analysis for SEEK
Above you can see how the current ROCE for SEEK compares to its prior returns on capital, but there's only so much you can tell from the past. If you'd like, you can check out the forecasts from the analysts covering SEEK here for free.
What Can We Tell From SEEK's ROCE Trend?
When we looked at the ROCE trend at SEEK, we didn't gain much confidence. To be more specific, ROCE has fallen from 12% over the last five years. Although, given both revenue and the amount of assets employed in the business have increased, it could suggest the company is investing in growth, and the extra capital has led to a short-term reduction in ROCE. And if the increased capital generates additional returns, the business, and thus shareholders, will benefit in the long run.
On a side note, SEEK's current liabilities have increased over the last five years to 28% of total assets, effectively distorting the ROCE to some degree. Without this increase, it's likely that ROCE would be even lower than 6.8%. Keep an eye on this ratio, because the business could encounter some new risks if this metric gets too high.
In Conclusion...
While returns have fallen for SEEK in recent times, we're encouraged to see that sales are growing and that the business is reinvesting in its operations. And the stock has done incredibly well with a 127% return over the last five years, so long term investors are no doubt ecstatic with that result. So while the underlying trends could already be accounted for by investors, we still think this stock is worth looking into further.
On a final note, we've found 2 warning signs for SEEK that we think you should be aware of.
For those who like to invest in solid companies, check out this free list of companies with solid balance sheets and high returns on equity.
Have feedback on this article? Concerned about the content? Get in touch with us directly. Alternatively, email editorial-team (at) simplywallst.com.
This article by Simply Wall St is general in nature. We provide commentary based on historical data and analyst forecasts only using an unbiased methodology and our articles are not intended to be financial advice. It does not constitute a recommendation to buy or sell any stock, and does not take account of your objectives, or your financial situation. We aim to bring you long-term focused analysis driven by fundamental data. Note that our analysis may not factor in the latest price-sensitive company announcements or qualitative material. Simply Wall St has no position in any stocks mentioned.
