
 Yahoo Finance
 Investors Could Be Concerned With Knights Group Holdings' (LON:KGH) Returns On Capital
What are the early trends we should look for to identify a stock that could multiply in value over the long term? Firstly, we'd want to identify a growing return on capital employed (ROCE) and then alongside that, an ever-increasing base of capital employed. Basically this means that a company has profitable initiatives that it can continue to reinvest in, which is a trait of a compounding machine. In light of that, when we looked at Knights Group Holdings (LON:KGH) and its ROCE trend, we weren't exactly thrilled.
Return On Capital Employed (ROCE): What is it?
For those that aren't sure what ROCE is, it measures the amount of pre-tax profits a company can generate from the capital employed in its business. To calculate this metric for Knights Group Holdings, this is the formula:
Return on Capital Employed = Earnings Before Interest and Tax (EBIT) ÷ (Total Assets - Current Liabilities)
0.11 = UK£17m ÷ (UK£194m - UK£40m) (Based on the trailing twelve months to April 2021).
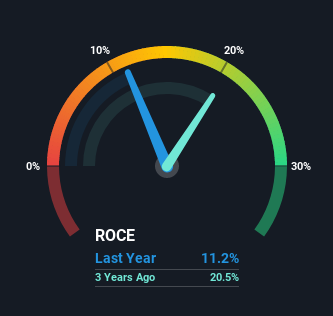
So, Knights Group Holdings has an ROCE of 11%. That's a relatively normal return on capital, and it's around the 12% generated by the Professional Services industry.
View our latest analysis for Knights Group Holdings
Above you can see how the current ROCE for Knights Group Holdings compares to its prior returns on capital, but there's only so much you can tell from the past. If you'd like, you can check out the forecasts from the analysts covering Knights Group Holdings here for free.
So How Is Knights Group Holdings' ROCE Trending?
In terms of Knights Group Holdings' historical ROCE movements, the trend isn't fantastic. Over the last five years, returns on capital have decreased to 11% from 46% five years ago. Although, given both revenue and the amount of assets employed in the business have increased, it could suggest the company is investing in growth, and the extra capital has led to a short-term reduction in ROCE. And if the increased capital generates additional returns, the business, and thus shareholders, will benefit in the long run.
On a related note, Knights Group Holdings has decreased its current liabilities to 21% of total assets. Since the ratio used to be 75%, that's a significant reduction and it no doubt explains the drop in ROCE. What's more, this can reduce some aspects of risk to the business because now the company's suppliers or short-term creditors are funding less of its operations. Since the business is basically funding more of its operations with it's own money, you could argue this has made the business less efficient at generating ROCE.
In Conclusion...
While returns have fallen for Knights Group Holdings in recent times, we're encouraged to see that sales are growing and that the business is reinvesting in its operations. And the stock has done incredibly well with a 110% return over the last three years, so long term investors are no doubt ecstatic with that result. So while investors seem to be recognizing these promising trends, we would look further into this stock to make sure the other metrics justify the positive view.
If you want to continue researching Knights Group Holdings, you might be interested to know about the 1 warning sign that our analysis has discovered.
If you want to search for solid companies with great earnings, check out this free list of companies with good balance sheets and impressive returns on equity.
This article by Simply Wall St is general in nature. We provide commentary based on historical data and analyst forecasts only using an unbiased methodology and our articles are not intended to be financial advice. It does not constitute a recommendation to buy or sell any stock, and does not take account of your objectives, or your financial situation. We aim to bring you long-term focused analysis driven by fundamental data. Note that our analysis may not factor in the latest price-sensitive company announcements or qualitative material. Simply Wall St has no position in any stocks mentioned.
Have feedback on this article? Concerned about the content? Get in touch with us directly. Alternatively, email editorial-team (at) simplywallst.com.
