
 Yahoo Finance
 Investors in Constellation Brands (NYSE:STZ) have seen notable returns of 39% over the past five years
The main point of investing for the long term is to make money. Furthermore, you'd generally like to see the share price rise faster than the market. But Constellation Brands, Inc. (NYSE:STZ) has fallen short of that second goal, with a share price rise of 29% over five years, which is below the market return. Zooming in, the stock is up a respectable 14% in the last year.
Let's take a look at the underlying fundamentals over the longer term, and see if they've been consistent with shareholders returns.
See our latest analysis for Constellation Brands
There is no denying that markets are sometimes efficient, but prices do not always reflect underlying business performance. By comparing earnings per share (EPS) and share price changes over time, we can get a feel for how investor attitudes to a company have morphed over time.
During the last half decade, Constellation Brands became profitable. That's generally thought to be a genuine positive, so investors may expect to see an increasing share price.
The image below shows how EPS has tracked over time (if you click on the image you can see greater detail).
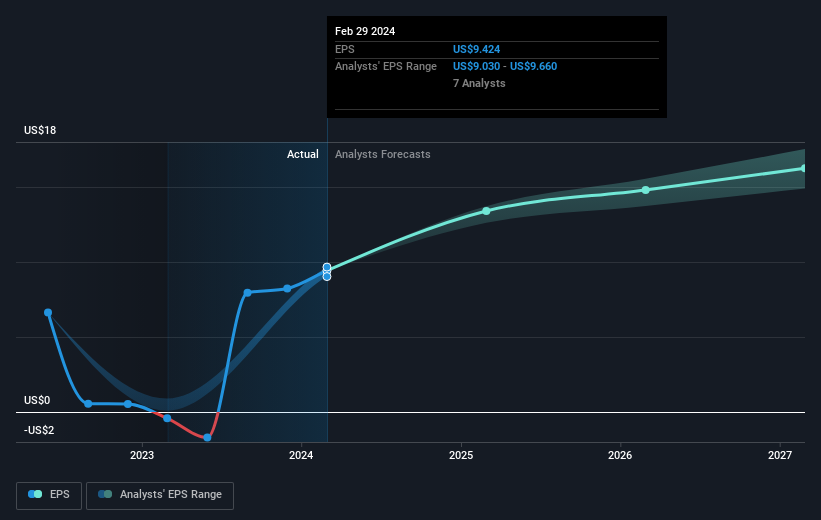
We know that Constellation Brands has improved its bottom line lately, but is it going to grow revenue? You could check out this free report showing analyst revenue forecasts.
What About Dividends?
As well as measuring the share price return, investors should also consider the total shareholder return (TSR). Whereas the share price return only reflects the change in the share price, the TSR includes the value of dividends (assuming they were reinvested) and the benefit of any discounted capital raising or spin-off. So for companies that pay a generous dividend, the TSR is often a lot higher than the share price return. As it happens, Constellation Brands' TSR for the last 5 years was 39%, which exceeds the share price return mentioned earlier. And there's no prize for guessing that the dividend payments largely explain the divergence!
A Different Perspective
Constellation Brands shareholders are up 15% for the year (even including dividends). Unfortunately this falls short of the market return. On the bright side, that's still a gain, and it's actually better than the average return of 7% over half a decade It is possible that returns will improve along with the business fundamentals. I find it very interesting to look at share price over the long term as a proxy for business performance. But to truly gain insight, we need to consider other information, too. To that end, you should be aware of the 3 warning signs we've spotted with Constellation Brands .
We will like Constellation Brands better if we see some big insider buys. While we wait, check out this free list of growing companies with considerable, recent, insider buying.
Please note, the market returns quoted in this article reflect the market weighted average returns of stocks that currently trade on American exchanges.
Have feedback on this article? Concerned about the content? Get in touch with us directly. Alternatively, email editorial-team (at) simplywallst.com.
This article by Simply Wall St is general in nature. We provide commentary based on historical data and analyst forecasts only using an unbiased methodology and our articles are not intended to be financial advice. It does not constitute a recommendation to buy or sell any stock, and does not take account of your objectives, or your financial situation. We aim to bring you long-term focused analysis driven by fundamental data. Note that our analysis may not factor in the latest price-sensitive company announcements or qualitative material. Simply Wall St has no position in any stocks mentioned.
