
 Yahoo Finance
 Investors in ClearView Wealth (ASX:CVW) have unfortunately lost 64% over the last five years
ClearView Wealth Limited (ASX:CVW) shareholders should be happy to see the share price up 10% in the last quarter. But that doesn't change the fact that the returns over the last half decade have been disappointing. In fact, the share price has declined rather badly, down some 66% in that time. So we're not so sure if the recent bounce should be celebrated. Of course, this could be the start of a turnaround.
So let's have a look and see if the longer term performance of the company has been in line with the underlying business' progress.
See our latest analysis for ClearView Wealth
There is no denying that markets are sometimes efficient, but prices do not always reflect underlying business performance. By comparing earnings per share (EPS) and share price changes over time, we can get a feel for how investor attitudes to a company have morphed over time.
During the five years over which the share price declined, ClearView Wealth's earnings per share (EPS) dropped by 14% each year. This reduction in EPS is less than the 20% annual reduction in the share price. This implies that the market was previously too optimistic about the stock.
The company's earnings per share (over time) is depicted in the image below (click to see the exact numbers).
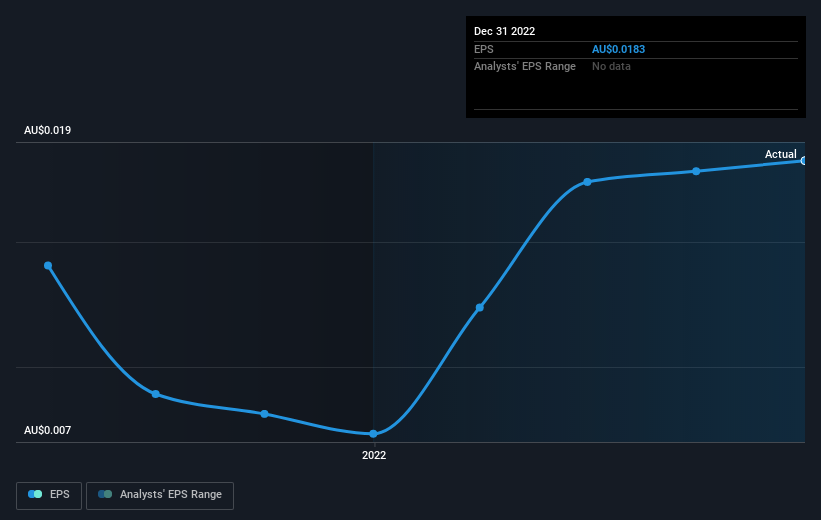
Dive deeper into ClearView Wealth's key metrics by checking this interactive graph of ClearView Wealth's earnings, revenue and cash flow.
What About Dividends?
As well as measuring the share price return, investors should also consider the total shareholder return (TSR). Whereas the share price return only reflects the change in the share price, the TSR includes the value of dividends (assuming they were reinvested) and the benefit of any discounted capital raising or spin-off. So for companies that pay a generous dividend, the TSR is often a lot higher than the share price return. As it happens, ClearView Wealth's TSR for the last 5 years was -64%, which exceeds the share price return mentioned earlier. The dividends paid by the company have thusly boosted the total shareholder return.
A Different Perspective
While the broader market gained around 4.5% in the last year, ClearView Wealth shareholders lost 21% (even including dividends). However, keep in mind that even the best stocks will sometimes underperform the market over a twelve month period. Unfortunately, last year's performance may indicate unresolved challenges, given that it was worse than the annualised loss of 10% over the last half decade. Generally speaking long term share price weakness can be a bad sign, though contrarian investors might want to research the stock in hope of a turnaround. While it is well worth considering the different impacts that market conditions can have on the share price, there are other factors that are even more important. Take risks, for example - ClearView Wealth has 2 warning signs (and 1 which is a bit concerning) we think you should know about.
Of course ClearView Wealth may not be the best stock to buy. So you may wish to see this free collection of growth stocks.
Please note, the market returns quoted in this article reflect the market weighted average returns of stocks that currently trade on AU exchanges.
Have feedback on this article? Concerned about the content? Get in touch with us directly. Alternatively, email editorial-team (at) simplywallst.com.
This article by Simply Wall St is general in nature. We provide commentary based on historical data and analyst forecasts only using an unbiased methodology and our articles are not intended to be financial advice. It does not constitute a recommendation to buy or sell any stock, and does not take account of your objectives, or your financial situation. We aim to bring you long-term focused analysis driven by fundamental data. Note that our analysis may not factor in the latest price-sensitive company announcements or qualitative material. Simply Wall St has no position in any stocks mentioned.
Join A Paid User Research Session
You’ll receive a US$30 Amazon Gift card for 1 hour of your time while helping us build better investing tools for the individual investors like yourself. Sign up here
