
 Yahoo Finance
 Investors Who Bought Ohio Valley Banc (NASDAQ:OVBC) Shares Three Years Ago Are Now Up 59%

By buying an index fund, you can roughly match the market return with ease. But if you pick the right individual stocks, you could make more than that. For example, the Ohio Valley Banc Corp. (NASDAQ:OVBC) share price is up 59% in the last three years, clearly besting than the market return of around 39% (not including dividends).
Check out our latest analysis for Ohio Valley Banc
While the efficient markets hypothesis continues to be taught by some, it has been proven that markets are over-reactive dynamic systems, and investors are not always rational. One imperfect but simple way to consider how the market perception of a company has shifted is to compare the change in the earnings per share (EPS) with the share price movement.
During three years of share price growth, Ohio Valley Banc achieved compound earnings per share growth of 6.7% per year. In comparison, the 17% per year gain in the share price outpaces the EPS growth. This indicates that the market is feeling more optimistic on the stock, after the last few years of progress. It’s not unusual to see the market ‘re-rate’ a stock, after a few years of growth.
You can see how EPS has changed over time in the image below (click on the chart to see the exact values).
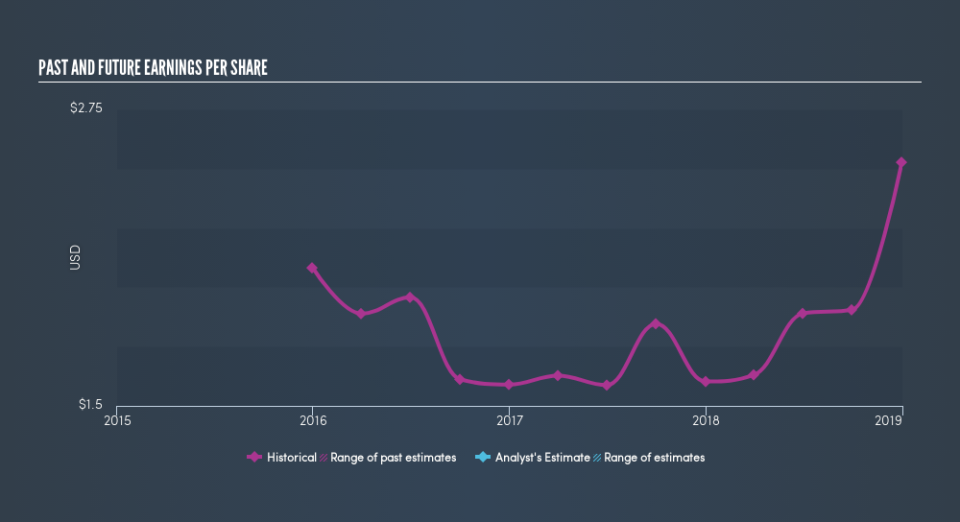
Dive deeper into Ohio Valley Banc’s key metrics by checking this interactive graph of Ohio Valley Banc’s earnings, revenue and cash flow.
What About Dividends?
When looking at investment returns, it is important to consider the difference between total shareholder return (TSR) and share price return. The TSR incorporates the value of any discounted capital raisings, along with any dividends, based on the assumption that the dividends are reinvested. So for companies that pay a generous dividend, the TSR is often a lot higher than the share price return. In the case of Ohio Valley Banc, it has a TSR of 72% for the last 3 years. That exceeds its share price return that we previously mentioned. The dividends paid by the company have thusly boosted the total shareholder return.
A Different Perspective
Ohio Valley Banc shareholders are down 14% for the year (even including dividends), but the market itself is up 3.1%. However, keep in mind that even the best stocks will sometimes underperform the market over a twelve month period. Longer term investors wouldn’t be so upset, since they would have made 13%, each year, over five years. If the fundamental data continues to indicate long term sustainable growth, the current sell-off could be an opportunity worth considering. If you would like to research Ohio Valley Banc in more detail then you might want to take a look at whether insiders have been buying or selling shares in the company.
We will like Ohio Valley Banc better if we see some big insider buys. While we wait, check out this free list of growing companies with considerable, recent, insider buying.
Please note, the market returns quoted in this article reflect the market weighted average returns of stocks that currently trade on US exchanges.
We aim to bring you long-term focused research analysis driven by fundamental data. Note that our analysis may not factor in the latest price-sensitive company announcements or qualitative material.
If you spot an error that warrants correction, please contact the editor at editorial-team@simplywallst.com. This article by Simply Wall St is general in nature. It does not constitute a recommendation to buy or sell any stock, and does not take account of your objectives, or your financial situation. Simply Wall St has no position in the stocks mentioned. Thank you for reading.
