
 Yahoo Finance
 Investors in Bigtincan Holdings (ASX:BTH) have made a stellar return of 138% over the past five years
Some Bigtincan Holdings Limited (ASX:BTH) shareholders are probably rather concerned to see the share price fall 33% over the last three months. But that doesn't change the fact that the returns over the last five years have been very strong. In fact, the share price is 129% higher today. To some, the recent pullback wouldn't be surprising after such a fast rise. Only time will tell if there is still too much optimism currently reflected in the share price. While the long term returns are impressive, we do have some sympathy for those who bought more recently, given the 54% drop, in the last year.
Now it's worth having a look at the company's fundamentals too, because that will help us determine if the long term shareholder return has matched the performance of the underlying business.
Check out our latest analysis for Bigtincan Holdings
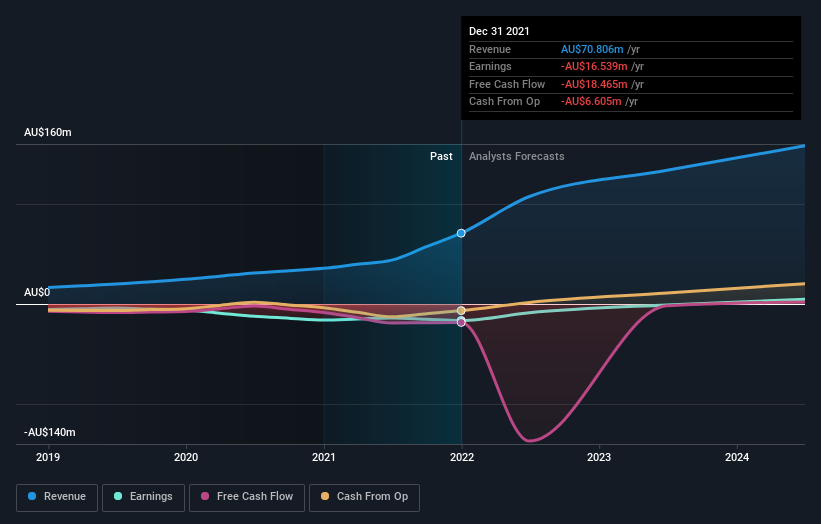
Because Bigtincan Holdings made a loss in the last twelve months, we think the market is probably more focussed on revenue and revenue growth, at least for now. Shareholders of unprofitable companies usually expect strong revenue growth. Some companies are willing to postpone profitability to grow revenue faster, but in that case one does expect good top-line growth.
For the last half decade, Bigtincan Holdings can boast revenue growth at a rate of 40% per year. That's well above most pre-profit companies. So it's not entirely surprising that the share price reflected this performance by increasing at a rate of 18% per year, in that time. So it seems likely that buyers have paid attention to the strong revenue growth. To our minds that makes Bigtincan Holdings worth investigating - it may have its best days ahead.
You can see how earnings and revenue have changed over time in the image below (click on the chart to see the exact values).
You can see how its balance sheet has strengthened (or weakened) over time in this free interactive graphic.
What about the Total Shareholder Return (TSR)?
Investors should note that there's a difference between Bigtincan Holdings' total shareholder return (TSR) and its share price change, which we've covered above. Arguably the TSR is a more complete return calculation because it accounts for the value of dividends (as if they were reinvested), along with the hypothetical value of any discounted capital that have been offered to shareholders. We note that Bigtincan Holdings' TSR, at 138% is higher than its share price return of 129%. When you consider it hasn't been paying a dividend, this data suggests shareholders have benefitted from a spin-off, or had the opportunity to acquire attractively priced shares in a discounted capital raising.
A Different Perspective
We regret to report that Bigtincan Holdings shareholders are down 53% for the year. Unfortunately, that's worse than the broader market decline of 1.4%. However, it could simply be that the share price has been impacted by broader market jitters. It might be worth keeping an eye on the fundamentals, in case there's a good opportunity. Longer term investors wouldn't be so upset, since they would have made 19%, each year, over five years. It could be that the recent sell-off is an opportunity, so it may be worth checking the fundamental data for signs of a long term growth trend. I find it very interesting to look at share price over the long term as a proxy for business performance. But to truly gain insight, we need to consider other information, too. Take risks, for example - Bigtincan Holdings has 3 warning signs (and 1 which can't be ignored) we think you should know about.
If you would prefer to check out another company -- one with potentially superior financials -- then do not miss this free list of companies that have proven they can grow earnings.
Please note, the market returns quoted in this article reflect the market weighted average returns of stocks that currently trade on AU exchanges.
Have feedback on this article? Concerned about the content? Get in touch with us directly. Alternatively, email editorial-team (at) simplywallst.com.
This article by Simply Wall St is general in nature. We provide commentary based on historical data and analyst forecasts only using an unbiased methodology and our articles are not intended to be financial advice. It does not constitute a recommendation to buy or sell any stock, and does not take account of your objectives, or your financial situation. We aim to bring you long-term focused analysis driven by fundamental data. Note that our analysis may not factor in the latest price-sensitive company announcements or qualitative material. Simply Wall St has no position in any stocks mentioned.