
 Yahoo Finance
 Investors Appear Satisfied With NIKE, Inc.'s (NYSE:NKE) Prospects
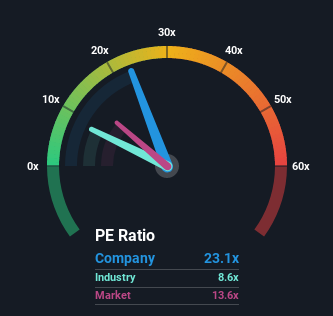
When close to half the companies in the United States have price-to-earnings ratios (or "P/E's") below 13x, you may consider NIKE, Inc. (NYSE:NKE) as a stock to avoid entirely with its 23.1x P/E ratio. Nonetheless, we'd need to dig a little deeper to determine if there is a rational basis for the highly elevated P/E.
While the market has experienced earnings growth lately, NIKE's earnings have gone into reverse gear, which is not great. It might be that many expect the dour earnings performance to recover substantially, which has kept the P/E from collapsing. You'd really hope so, otherwise you're paying a pretty hefty price for no particular reason.
Check out our latest analysis for NIKE
Want the full picture on analyst estimates for the company? Then our free report on NIKE will help you uncover what's on the horizon.
Does Growth Match The High P/E?
The only time you'd be truly comfortable seeing a P/E as steep as NIKE's is when the company's growth is on track to outshine the market decidedly.
Taking a look back first, the company's earnings per share growth last year wasn't something to get excited about as it posted a disappointing decline of 7.1%. However, a few very strong years before that means that it was still able to grow EPS by an impressive 31% in total over the last three years. Accordingly, while they would have preferred to keep the run going, shareholders would probably welcome the medium-term rates of earnings growth.
Shifting to the future, estimates from the analysts covering the company suggest earnings should grow by 13% per annum over the next three years. That's shaping up to be materially higher than the 9.6% per annum growth forecast for the broader market.
In light of this, it's understandable that NIKE's P/E sits above the majority of other companies. It seems most investors are expecting this strong future growth and are willing to pay more for the stock.
The Key Takeaway
It's argued the price-to-earnings ratio is an inferior measure of value within certain industries, but it can be a powerful business sentiment indicator.
We've established that NIKE maintains its high P/E on the strength of its forecast growth being higher than the wider market, as expected. Right now shareholders are comfortable with the P/E as they are quite confident future earnings aren't under threat. Unless these conditions change, they will continue to provide strong support to the share price.
Many other vital risk factors can be found on the company's balance sheet. Our free balance sheet analysis for NIKE with six simple checks will allow you to discover any risks that could be an issue.
You might be able to find a better investment than NIKE. If you want a selection of possible candidates, check out this free list of interesting companies that trade on a P/E below 20x (but have proven they can grow earnings).
Have feedback on this article? Concerned about the content? Get in touch with us directly. Alternatively, email editorial-team (at) simplywallst.com.
This article by Simply Wall St is general in nature. We provide commentary based on historical data and analyst forecasts only using an unbiased methodology and our articles are not intended to be financial advice. It does not constitute a recommendation to buy or sell any stock, and does not take account of your objectives, or your financial situation. We aim to bring you long-term focused analysis driven by fundamental data. Note that our analysis may not factor in the latest price-sensitive company announcements or qualitative material. Simply Wall St has no position in any stocks mentioned.
Join A Paid User Research Session
You’ll receive a US$30 Amazon Gift card for 1 hour of your time while helping us build better investing tools for the individual investors like yourself. Sign up here
