
 Yahoo Finance
 Investors in a2 Milk (NZSE:ATM) have unfortunately lost 54% over the last three years
While not a mind-blowing move, it is good to see that the The a2 Milk Company Limited (NZSE:ATM) share price has gained 24% in the last three months. But that doesn't change the fact that the returns over the last three years have been disappointing. Indeed, the share price is down a tragic 54% in the last three years. So the improvement may be a real relief to some. While many would remain nervous, there could be further gains if the business can put its best foot forward.
Since shareholders are down over the longer term, lets look at the underlying fundamentals over the that time and see if they've been consistent with returns.
See our latest analysis for a2 Milk
While the efficient markets hypothesis continues to be taught by some, it has been proven that markets are over-reactive dynamic systems, and investors are not always rational. One flawed but reasonable way to assess how sentiment around a company has changed is to compare the earnings per share (EPS) with the share price.
During the three years that the share price fell, a2 Milk's earnings per share (EPS) dropped by 26% each year. This fall in EPS isn't far from the rate of share price decline, which was 23% per year. So it seems that investor expectations of the company are staying pretty steady, despite the disappointment. Rather, the share price has approximately tracked EPS growth.
You can see below how EPS has changed over time (discover the exact values by clicking on the image).
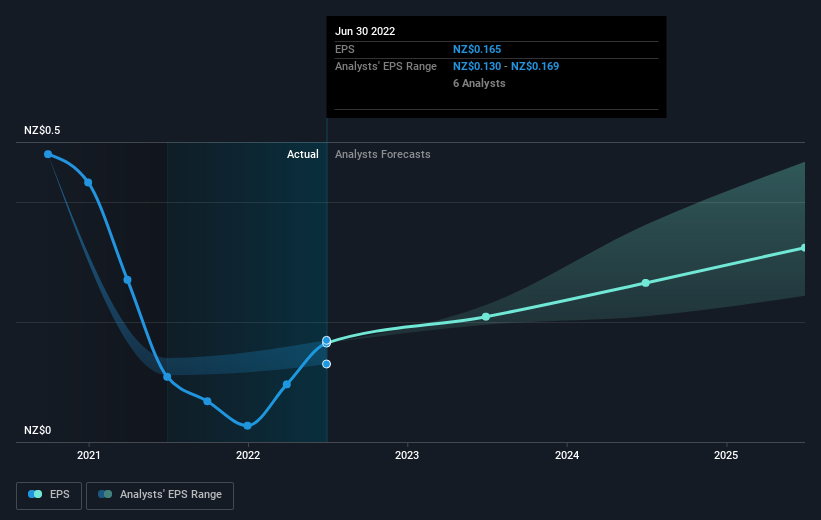
We know that a2 Milk has improved its bottom line lately, but is it going to grow revenue? This free report showing analyst revenue forecasts should help you figure out if the EPS growth can be sustained.
A Different Perspective
While it's never nice to take a loss, a2 Milk shareholders can take comfort that their trailing twelve month loss of 10.0% wasn't as bad as the market loss of around 15%. Unfortunately, last year's performance may indicate unresolved challenges, given that it's worse than the annualised loss of 4% over the last half decade. Whilst Baron Rothschild does tell the investor "buy when there's blood in the streets, even if the blood is your own", buyers would need to examine the data carefully to be comfortable that the business itself is sound. While it is well worth considering the different impacts that market conditions can have on the share price, there are other factors that are even more important. Even so, be aware that a2 Milk is showing 1 warning sign in our investment analysis , you should know about...
If you would prefer to check out another company -- one with potentially superior financials -- then do not miss this free list of companies that have proven they can grow earnings.
Please note, the market returns quoted in this article reflect the market weighted average returns of stocks that currently trade on NZ exchanges.
Have feedback on this article? Concerned about the content? Get in touch with us directly. Alternatively, email editorial-team (at) simplywallst.com.
This article by Simply Wall St is general in nature. We provide commentary based on historical data and analyst forecasts only using an unbiased methodology and our articles are not intended to be financial advice. It does not constitute a recommendation to buy or sell any stock, and does not take account of your objectives, or your financial situation. We aim to bring you long-term focused analysis driven by fundamental data. Note that our analysis may not factor in the latest price-sensitive company announcements or qualitative material. Simply Wall St has no position in any stocks mentioned.
Join A Paid User Research Session
You’ll receive a US$30 Amazon Gift card for 1 hour of your time while helping us build better investing tools for the individual investors like yourself. Sign up here
