
 Yahoo Finance
 Investing in Redbubble (ASX:RBL) five years ago would have delivered you a 288% gain
It hasn't been the best quarter for Redbubble Limited (ASX:RBL) shareholders, since the share price has fallen 23% in that time. But in stark contrast, the returns over the last half decade have impressed. It's fair to say most would be happy with 285% the gain in that time. To some, the recent pullback wouldn't be surprising after such a fast rise. The more important question is whether the stock is too cheap or too expensive today. While the long term returns are impressive, we do have some sympathy for those who bought more recently, given the 41% drop, in the last year.
Let's take a look at the underlying fundamentals over the longer term, and see if they've been consistent with shareholders returns.
See our latest analysis for Redbubble
There is no denying that markets are sometimes efficient, but prices do not always reflect underlying business performance. One imperfect but simple way to consider how the market perception of a company has shifted is to compare the change in the earnings per share (EPS) with the share price movement.
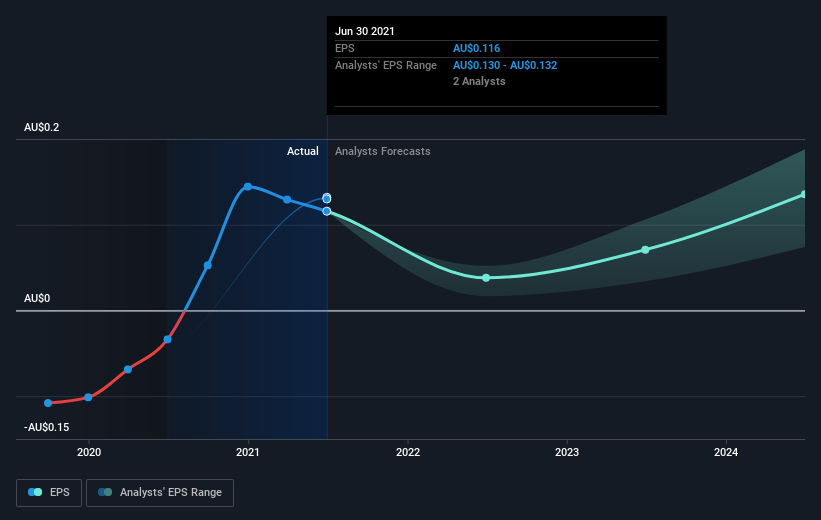
During the five years of share price growth, Redbubble moved from a loss to profitability. Sometimes, the start of profitability is a major inflection point that can signal fast earnings growth to come, which in turn justifies very strong share price gains.
The company's earnings per share (over time) is depicted in the image below (click to see the exact numbers).
It is of course excellent to see how Redbubble has grown profits over the years, but the future is more important for shareholders. Take a more thorough look at Redbubble's financial health with this free report on its balance sheet.
What about the Total Shareholder Return (TSR)?
Investors should note that there's a difference between Redbubble's total shareholder return (TSR) and its share price change, which we've covered above. The TSR attempts to capture the value of dividends (as if they were reinvested) as well as any spin-offs or discounted capital raisings offered to shareholders. Redbubble hasn't been paying dividends, but its TSR of 288% exceeds its share price return of 285%, implying it has either spun-off a business, or raised capital at a discount; thereby providing additional value to shareholders.
A Different Perspective
While the broader market gained around 16% in the last year, Redbubble shareholders lost 41%. However, keep in mind that even the best stocks will sometimes underperform the market over a twelve month period. On the bright side, long term shareholders have made money, with a gain of 31% per year over half a decade. If the fundamental data continues to indicate long term sustainable growth, the current sell-off could be an opportunity worth considering. It's always interesting to track share price performance over the longer term. But to understand Redbubble better, we need to consider many other factors. Consider risks, for instance. Every company has them, and we've spotted 2 warning signs for Redbubble you should know about.
If you would prefer to check out another company -- one with potentially superior financials -- then do not miss this free list of companies that have proven they can grow earnings.
Please note, the market returns quoted in this article reflect the market weighted average returns of stocks that currently trade on AU exchanges.
Have feedback on this article? Concerned about the content? Get in touch with us directly. Alternatively, email editorial-team (at) simplywallst.com.
This article by Simply Wall St is general in nature. We provide commentary based on historical data and analyst forecasts only using an unbiased methodology and our articles are not intended to be financial advice. It does not constitute a recommendation to buy or sell any stock, and does not take account of your objectives, or your financial situation. We aim to bring you long-term focused analysis driven by fundamental data. Note that our analysis may not factor in the latest price-sensitive company announcements or qualitative material. Simply Wall St has no position in any stocks mentioned.
