
 Yahoo Finance
 Investing in PPK Group (ASX:PPK) five years ago would have delivered you a 308% gain
While PPK Group Limited (ASX:PPK) shareholders are probably generally happy, the stock hasn't had particularly good run recently, with the share price falling 25% in the last quarter. But in stark contrast, the returns over the last half decade have impressed. In fact, the share price is 276% higher today. We think it's more important to dwell on the long term returns than the short term returns. The more important question is whether the stock is too cheap or too expensive today. Unfortunately not all shareholders will have held it for five years, so spare a thought for those caught in the 68% decline over the last three years: that's a long time to wait for profits.
So let's investigate and see if the longer term performance of the company has been in line with the underlying business' progress.
View our latest analysis for PPK Group
PPK Group isn't currently profitable, so most analysts would look to revenue growth to get an idea of how fast the underlying business is growing. When a company doesn't make profits, we'd generally expect to see good revenue growth. As you can imagine, fast revenue growth, when maintained, often leads to fast profit growth.
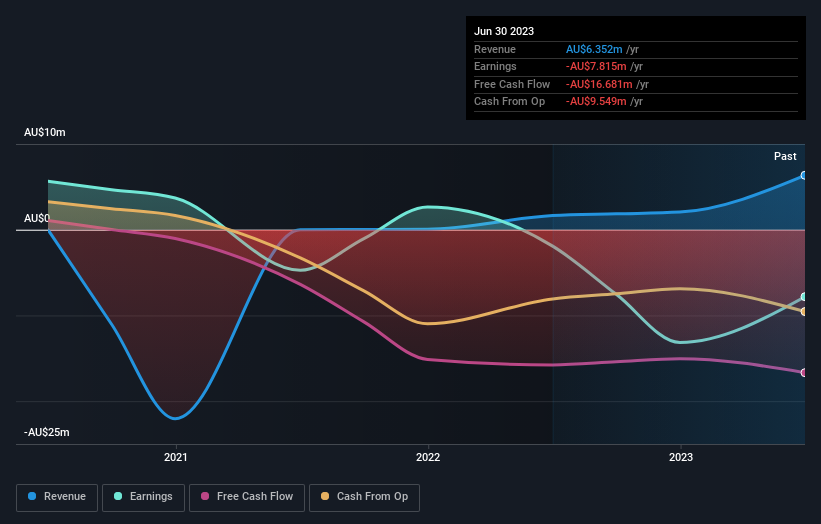
In the last 5 years PPK Group saw its revenue shrink by 53% per year. On the other hand, the share price done the opposite, gaining 30%, compound, each year. It's a good reminder that expectations about the future, not the past history, always impact share prices. Still, we are a bit cautious in this kind of situation.
The company's revenue and earnings (over time) are depicted in the image below (click to see the exact numbers).
It's good to see that there was some significant insider buying in the last three months. That's a positive. On the other hand, we think the revenue and earnings trends are much more meaningful measures of the business. Dive deeper into the earnings by checking this interactive graph of PPK Group's earnings, revenue and cash flow.
What About The Total Shareholder Return (TSR)?
Investors should note that there's a difference between PPK Group's total shareholder return (TSR) and its share price change, which we've covered above. The TSR attempts to capture the value of dividends (as if they were reinvested) as well as any spin-offs or discounted capital raisings offered to shareholders. Its history of dividend payouts mean that PPK Group's TSR of 308% over the last 5 years is better than the share price return.
A Different Perspective
While the broader market gained around 5.6% in the last year, PPK Group shareholders lost 28%. Even the share prices of good stocks drop sometimes, but we want to see improvements in the fundamental metrics of a business, before getting too interested. Longer term investors wouldn't be so upset, since they would have made 32%, each year, over five years. It could be that the recent sell-off is an opportunity, so it may be worth checking the fundamental data for signs of a long term growth trend. I find it very interesting to look at share price over the long term as a proxy for business performance. But to truly gain insight, we need to consider other information, too. To that end, you should learn about the 3 warning signs we've spotted with PPK Group (including 1 which can't be ignored) .
If you like to buy stocks alongside management, then you might just love this free list of companies. (Hint: insiders have been buying them).
Please note, the market returns quoted in this article reflect the market weighted average returns of stocks that currently trade on Australian exchanges.
Have feedback on this article? Concerned about the content? Get in touch with us directly. Alternatively, email editorial-team (at) simplywallst.com.
This article by Simply Wall St is general in nature. We provide commentary based on historical data and analyst forecasts only using an unbiased methodology and our articles are not intended to be financial advice. It does not constitute a recommendation to buy or sell any stock, and does not take account of your objectives, or your financial situation. We aim to bring you long-term focused analysis driven by fundamental data. Note that our analysis may not factor in the latest price-sensitive company announcements or qualitative material. Simply Wall St has no position in any stocks mentioned.
