
 Yahoo Finance
 Investing in DCC (LON:DCC) a year ago would have delivered you a 26% gain
These days it's easy to simply buy an index fund, and your returns should (roughly) match the market. But you can significantly boost your returns by picking above-average stocks. To wit, the DCC plc (LON:DCC) share price is 22% higher than it was a year ago, much better than the market return of around 7.4% (not including dividends) in the same period. That's a solid performance by our standards! On the other hand, longer term shareholders have had a tougher run, with the stock falling 6.8% in three years.
With that in mind, it's worth seeing if the company's underlying fundamentals have been the driver of long term performance, or if there are some discrepancies.
See our latest analysis for DCC
To paraphrase Benjamin Graham: Over the short term the market is a voting machine, but over the long term it's a weighing machine. One imperfect but simple way to consider how the market perception of a company has shifted is to compare the change in the earnings per share (EPS) with the share price movement.
Over the last twelve months, DCC actually shrank its EPS by 2.4%.
The mild decline in EPS may be a result of the fact that the company is more focused on other aspects of the business, right now. Since the change in EPS doesn't seem to correlate with the change in share price, it's worth taking a look at other metrics.
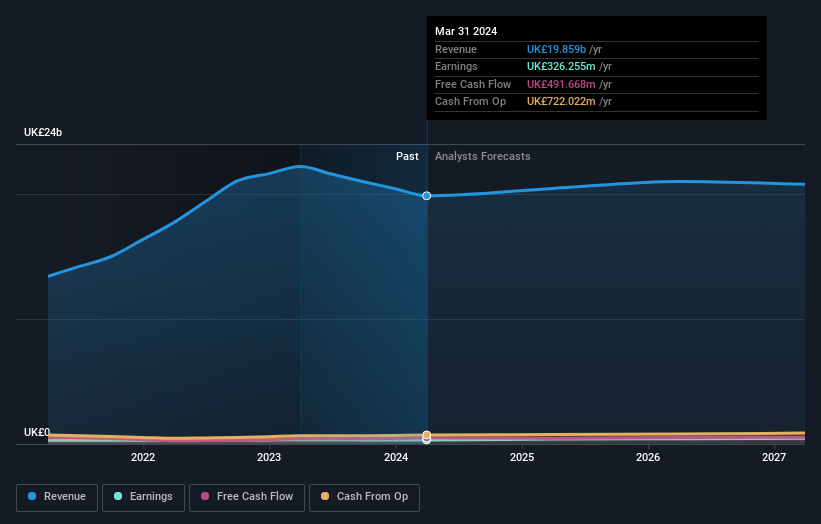
DCC's revenue actually dropped 11% over last year. So using a snapshot of key business metrics doesn't give us a good picture of why the market is bidding up the stock.
You can see how earnings and revenue have changed over time in the image below (click on the chart to see the exact values).
DCC is well known by investors, and plenty of clever analysts have tried to predict the future profit levels. You can see what analysts are predicting for DCC in this interactive graph of future profit estimates.
What About Dividends?
It is important to consider the total shareholder return, as well as the share price return, for any given stock. Whereas the share price return only reflects the change in the share price, the TSR includes the value of dividends (assuming they were reinvested) and the benefit of any discounted capital raising or spin-off. Arguably, the TSR gives a more comprehensive picture of the return generated by a stock. We note that for DCC the TSR over the last 1 year was 26%, which is better than the share price return mentioned above. The dividends paid by the company have thusly boosted the total shareholder return.
A Different Perspective
It's good to see that DCC has rewarded shareholders with a total shareholder return of 26% in the last twelve months. And that does include the dividend. There's no doubt those recent returns are much better than the TSR loss of 0.1% per year over five years. This makes us a little wary, but the business might have turned around its fortunes. Importantly, we haven't analysed DCC's dividend history. This free visual report on its dividends is a must-read if you're thinking of buying.
If you would prefer to check out another company -- one with potentially superior financials -- then do not miss this free list of companies that have proven they can grow earnings.
Please note, the market returns quoted in this article reflect the market weighted average returns of stocks that currently trade on British exchanges.
Have feedback on this article? Concerned about the content? Get in touch with us directly. Alternatively, email editorial-team (at) simplywallst.com.
This article by Simply Wall St is general in nature. We provide commentary based on historical data and analyst forecasts only using an unbiased methodology and our articles are not intended to be financial advice. It does not constitute a recommendation to buy or sell any stock, and does not take account of your objectives, or your financial situation. We aim to bring you long-term focused analysis driven by fundamental data. Note that our analysis may not factor in the latest price-sensitive company announcements or qualitative material. Simply Wall St has no position in any stocks mentioned.
