
 Yahoo Finance
 Should You Invest In Scentre Group (ASX:SCG)?

Scentre Group is a AU$22.01b large-cap, real estate investment trust (REIT) based in Sydney, Australia. REITs are basically a portfolio of income-producing real estate investments, which are owned and operated by management of that trust company. They have to meet certain requirements in order to become a REIT, meaning they should be analyzed a different way. Below, I’ll look at a few important metrics to keep in mind as part of your research on SCG.
See our latest analysis for Scentre Group
A common financial term REIT investors should know is Funds from Operations, or FFO for short, which is a REIT’s main source of income from its portfolio of property, such as rent. FFO is a cleaner and more representative figure of how much SCG actually makes from its day-to-day operations, compared to net income, which can be affected by one-off activities or non-cash items such as depreciation. For SCG, its FFO of AU$1.23b makes up 69.7% of its gross profit, which means the majority of its earnings are high-quality and recurring.
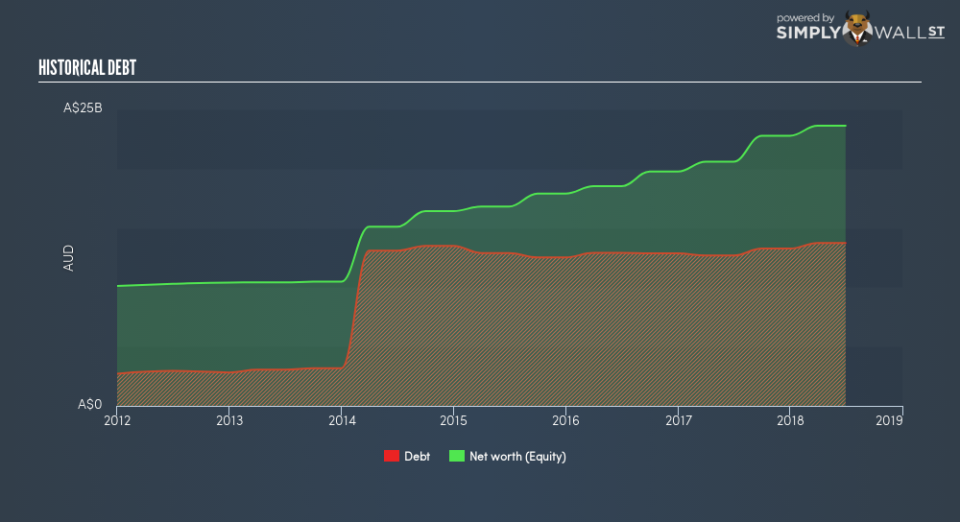
SCG’s financial stability can be gauged by seeing how much its FFO generated each year can cover its total amount of debt. The higher the coverage, the less risky SCG is, broadly speaking, to have debt on its books. The metric I’ll be using, FFO-to-debt, also estimates the time it will take for the company to repay its debt with its FFO. With a ratio of 9.2%, the credit rating agency Standard & Poor would consider this as aggressive risk. This would take SCG 10.82 years to pay off using just operating income, which is a long time, and risk increases with time. But realistically, companies have many levers to pull in order to pay back their debt, beyond operating income alone.
Next, interest coverage ratio shows how many times SCG’s earnings can cover its annual interest payments. Usually the ratio is calculated using EBIT, but for REITs, it’s better to use FFO divided by net interest. This is similar to the above concept, but looks at the nearer-term obligations. With an interest coverage ratio of 2.36x, SCG is not generating an appropriate amount of cash from its borrowings. Typically, a ratio of greater than 3x is seen as safe.
In terms of valuing SCG, FFO can also be used as a form of relative valuation. Instead of the P/E ratio, P/FFO is used instead, which is very common for REIT stocks. SCG’s price-to-FFO is 17.84x, compared to the long-term industry average of 16.5x, meaning that it is slightly overvalued.
Next Steps:
As a REIT, Scentre Group offers some unique characteristics which could help diversify your portfolio. However, before you decide on whether or not to invest in SCG, I highly recommend taking a look at other aspects of the stock to consider:
Future Outlook: What are well-informed industry analysts predicting for SCG’s future growth? Take a look at our free research report of analyst consensus for SCG’s outlook.
Valuation: What is SCG worth today? Is the stock undervalued, even when its growth outlook is factored into its intrinsic value? The intrinsic value infographic in our free research report helps visualize whether SCG is currently mispriced by the market.
Other High-Performing Stocks: Are there other stocks that provide better prospects with proven track records? Explore our free list of these great stocks here.
To help readers see past the short term volatility of the financial market, we aim to bring you a long-term focused research analysis purely driven by fundamental data. Note that our analysis does not factor in the latest price-sensitive company announcements.
The author is an independent contributor and at the time of publication had no position in the stocks mentioned. For errors that warrant correction please contact the editor at editorial-team@simplywallst.com.
