
 Yahoo Finance
 Introducing NEXTDC (ASX:NXT), The Stock That Zoomed 216% In The Last Five Years

When you buy a stock there is always a possibility that it could drop 100%. But when you pick a company that is really flourishing, you can make more than 100%. One great example is NEXTDC Limited (ASX:NXT) which saw its share price drive 216% higher over five years. We note the stock price is up 2.6% in the last seven days.
Check out our latest analysis for NEXTDC
Because NEXTDC is loss-making, we think the market is probably more focussed on revenue and revenue growth, at least for now. Shareholders of unprofitable companies usually expect strong revenue growth. Some companies are willing to postpone profitability to grow revenue faster, but in that case one does expect good top-line growth.
For the last half decade, NEXTDC can boast revenue growth at a rate of 27% per year. Even measured against other revenue-focussed companies, that's a good result. So it's not entirely surprising that the share price reflected this performance by increasing at a rate of 26% per year, in that time. This suggests the market has well and truly recognized the progress the business has made. NEXTDC seems like a high growth stock - so growth investors might want to add it to their watchlist.
You can see below how earnings and revenue have changed over time (discover the exact values by clicking on the image).
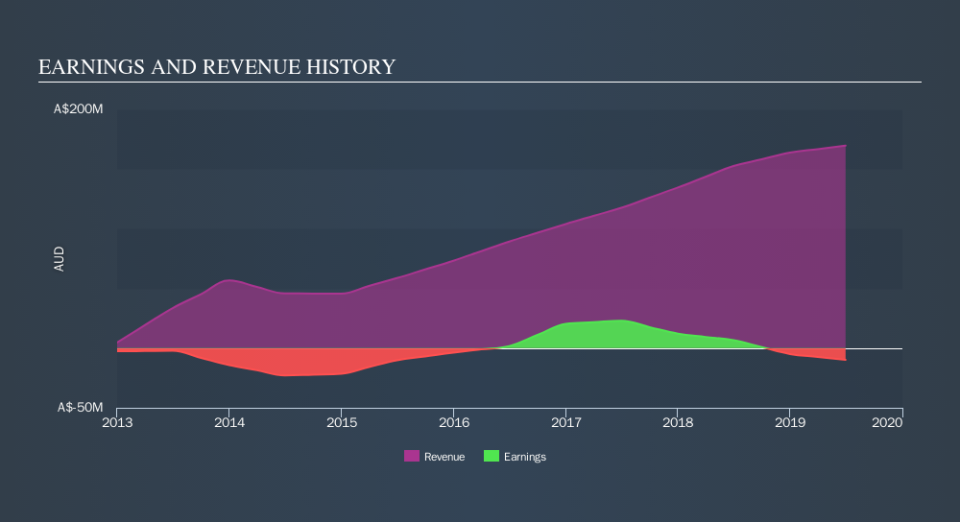
Take a more thorough look at NEXTDC's financial health with this free report on its balance sheet.
What about the Total Shareholder Return (TSR)?
We've already covered NEXTDC's share price action, but we should also mention its total shareholder return (TSR). Arguably the TSR is a more complete return calculation because it accounts for the value of dividends (as if they were reinvested), along with the hypothetical value of any discounted capital that have been offered to shareholders. We note that NEXTDC's TSR, at 225% is higher than its share price return of 216%. When you consider it hasn't been paying a dividend, this data suggests shareholders have benefitted from a spin-off, or had the opportunity to acquire attractively priced shares in a discounted capital raising.
A Different Perspective
NEXTDC shareholders gained a total return of 7.7% during the year. But that return falls short of the market. If we look back over five years, the returns are even better, coming in at 27% per year for five years. It's quite possible the business continues to execute with prowess, even as the share price gains are slowing. You might want to assess this data-rich visualization of its earnings, revenue and cash flow.
Of course NEXTDC may not be the best stock to buy. So you may wish to see this free collection of growth stocks.
Please note, the market returns quoted in this article reflect the market weighted average returns of stocks that currently trade on AU exchanges.
We aim to bring you long-term focused research analysis driven by fundamental data. Note that our analysis may not factor in the latest price-sensitive company announcements or qualitative material.
If you spot an error that warrants correction, please contact the editor at editorial-team@simplywallst.com. This article by Simply Wall St is general in nature. It does not constitute a recommendation to buy or sell any stock, and does not take account of your objectives, or your financial situation. Simply Wall St has no position in the stocks mentioned. Thank you for reading.
