
 Yahoo Finance
 Introducing MNF Group (ASX:MNF), A Stock That Climbed 92% In The Last Five Years

Want to participate in a research study? Help shape the future of investing tools and earn a $60 gift card!
When we invest, we're generally looking for stocks that outperform the market average. And in our experience, buying the right stocks can give your wealth a significant boost. For example, long term MNF Group Limited (ASX:MNF) shareholders have enjoyed a 92% share price rise over the last half decade, well in excess of the market return of around 4.7% (not including dividends).
View our latest analysis for MNF Group
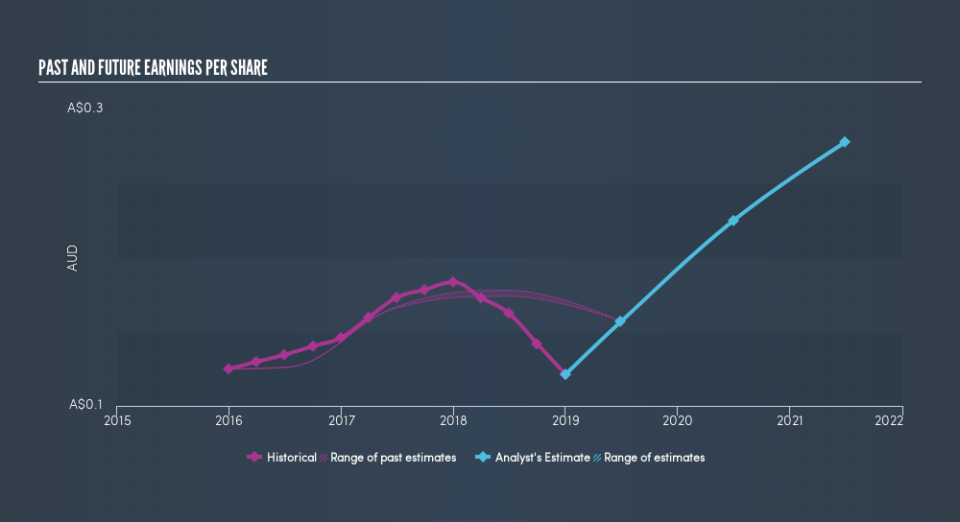
To quote Buffett, 'Ships will sail around the world but the Flat Earth Society will flourish. There will continue to be wide discrepancies between price and value in the marketplace...' One imperfect but simple way to consider how the market perception of a company has shifted is to compare the change in the earnings per share (EPS) with the share price movement.
During five years of share price growth, MNF Group achieved compound earnings per share (EPS) growth of 8.5% per year. This EPS growth is slower than the share price growth of 14% per year, over the same period. So it's fair to assume the market has a higher opinion of the business than it did five years ago. That's not necessarily surprising considering the five-year track record of earnings growth.
The image below shows how EPS has tracked over time (if you click on the image you can see greater detail).
Dive deeper into MNF Group's key metrics by checking this interactive graph of MNF Group's earnings, revenue and cash flow.
What About Dividends?
When looking at investment returns, it is important to consider the difference between total shareholder return (TSR) and share price return. The TSR incorporates the value of any spin-offs or discounted capital raisings, along with any dividends, based on the assumption that the dividends are reinvested. So for companies that pay a generous dividend, the TSR is often a lot higher than the share price return. We note that for MNF Group the TSR over the last 5 years was 109%, which is better than the share price return mentioned above. The dividends paid by the company have thusly boosted the total shareholder return.
A Different Perspective
MNF Group shareholders are down 24% for the year (even including dividends), but the market itself is up 11%. However, keep in mind that even the best stocks will sometimes underperform the market over a twelve month period. On the bright side, long term shareholders have made money, with a gain of 16% per year over half a decade. If the fundamental data continues to indicate long term sustainable growth, the current sell-off could be an opportunity worth considering. Is MNF Group cheap compared to other companies? These 3 valuation measures might help you decide.
If you would prefer to check out another company -- one with potentially superior financials -- then do not miss this free list of companies that have proven they can grow earnings.
Please note, the market returns quoted in this article reflect the market weighted average returns of stocks that currently trade on AU exchanges.
We aim to bring you long-term focused research analysis driven by fundamental data. Note that our analysis may not factor in the latest price-sensitive company announcements or qualitative material.
If you spot an error that warrants correction, please contact the editor at editorial-team@simplywallst.com. This article by Simply Wall St is general in nature. It does not constitute a recommendation to buy or sell any stock, and does not take account of your objectives, or your financial situation. Simply Wall St has no position in the stocks mentioned. Thank you for reading.
