
 Yahoo Finance
 Introducing Avery Dennison (NYSE:AVY), The Stock That Zoomed 125% In The Last Five Years
Want to participate in a short research study? Help shape the future of investing tools and you could win a $250 gift card!
When you buy a stock there is always a possibility that it could drop 100%. But on the bright side, you can make far more than 100% on a really good stock. One great example is Avery Dennison Corporation (NYSE:AVY) which saw its share price drive 125% higher over five years.
Check out our latest analysis for Avery Dennison
While the efficient markets hypothesis continues to be taught by some, it has been proven that markets are over-reactive dynamic systems, and investors are not always rational. One flawed but reasonable way to assess how sentiment around a company has changed is to compare the earnings per share (EPS) with the share price.
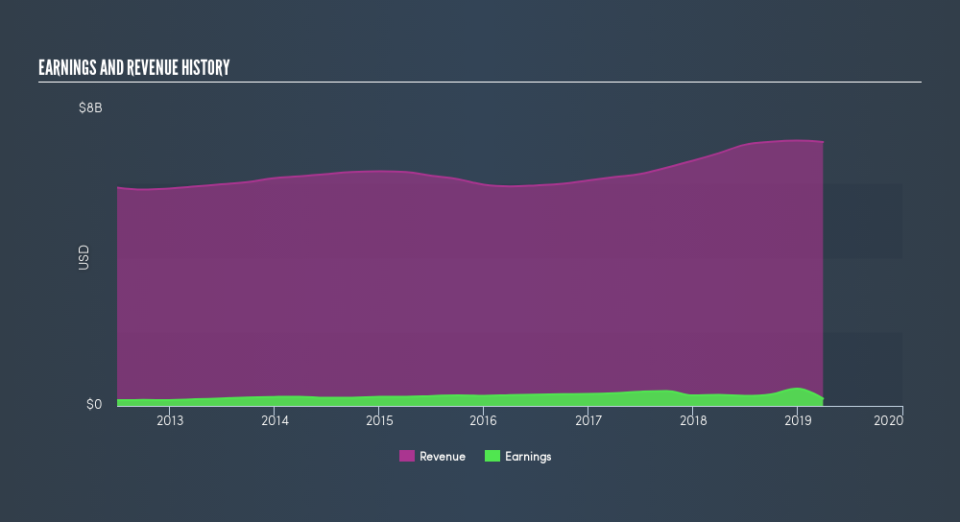
During five years of share price growth, Avery Dennison actually saw its EPS drop 2.4% per year. So it's hard to argue that the earnings per share are the best metric to judge the company, as it may not be optimized for profits at this point. Therefore, it's worth taking a look at other metrics to try to understand the share price movements.
We are not particularly impressed by the annual compound revenue growth of 3.0% over five years. So why is the share price up? It's not immediately obvious to us, but a closer look at the company's progress over time might yield answers.
Depicted in the graphic below, you'll see revenue and earnings over time. If you want more detail, you can click on the chart itself.
Avery Dennison is well known by investors, and plenty of clever analysts have tried to predict the future profit levels. You can see what analysts are predicting for Avery Dennison in this interactive graph of future profit estimates.
What About Dividends?
When looking at investment returns, it is important to consider the difference between total shareholder return (TSR) and share price return. The TSR is a return calculation that accounts for the value of cash dividends (assuming that any dividend received was reinvested) and the calculated value of any discounted capital raisings and spin-offs. Arguably, the TSR gives a more comprehensive picture of the return generated by a stock. In the case of Avery Dennison, it has a TSR of 151% for the last 5 years. That exceeds its share price return that we previously mentioned. This is largely a result of its dividend payments!
A Different Perspective
Avery Dennison shareholders are up 5.5% for the year (even including dividends). But that return falls short of the market. It's probably a good sign that the company has an even better long term track record, having provided shareholders with an annual TSR of 20% over five years. Maybe the share price is just taking a breather while the business executes on its growth strategy. Before spending more time on Avery Dennison it might be wise to click here to see if insiders have been buying or selling shares.
If you are like me, then you will not want to miss this free list of growing companies that insiders are buying.
Please note, the market returns quoted in this article reflect the market weighted average returns of stocks that currently trade on US exchanges.
We aim to bring you long-term focused research analysis driven by fundamental data. Note that our analysis may not factor in the latest price-sensitive company announcements or qualitative material.
If you spot an error that warrants correction, please contact the editor at editorial-team@simplywallst.com. This article by Simply Wall St is general in nature. It does not constitute a recommendation to buy or sell any stock, and does not take account of your objectives, or your financial situation. Simply Wall St has no position in the stocks mentioned. Thank you for reading.
