
 Yahoo Finance
 Interpublic Group of Companies (NYSE:IPG) Hasn't Managed To Accelerate Its Returns
If you're looking for a multi-bagger, there's a few things to keep an eye out for. Typically, we'll want to notice a trend of growing return on capital employed (ROCE) and alongside that, an expanding base of capital employed. Ultimately, this demonstrates that it's a business that is reinvesting profits at increasing rates of return. Having said that, from a first glance at Interpublic Group of Companies (NYSE:IPG) we aren't jumping out of our chairs at how returns are trending, but let's have a deeper look.
What Is Return On Capital Employed (ROCE)?
For those that aren't sure what ROCE is, it measures the amount of pre-tax profits a company can generate from the capital employed in its business. The formula for this calculation on Interpublic Group of Companies is:
Return on Capital Employed = Earnings Before Interest and Tax (EBIT) ÷ (Total Assets - Current Liabilities)
0.17 = US$1.5b ÷ (US$19b - US$10b) (Based on the trailing twelve months to December 2023).
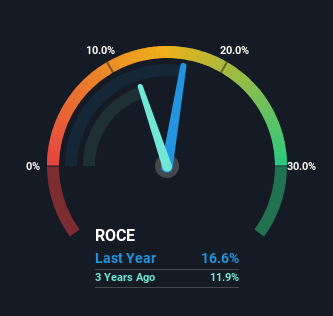
So, Interpublic Group of Companies has an ROCE of 17%. In absolute terms, that's a satisfactory return, but compared to the Media industry average of 8.8% it's much better.
See our latest analysis for Interpublic Group of Companies
In the above chart we have measured Interpublic Group of Companies' prior ROCE against its prior performance, but the future is arguably more important. If you'd like, you can check out the forecasts from the analysts covering Interpublic Group of Companies for free.
What Can We Tell From Interpublic Group of Companies' ROCE Trend?
There hasn't been much to report for Interpublic Group of Companies' returns and its level of capital employed because both metrics have been steady for the past five years. This tells us the company isn't reinvesting in itself, so it's plausible that it's past the growth phase. With that in mind, unless investment picks up again in the future, we wouldn't expect Interpublic Group of Companies to be a multi-bagger going forward. With fewer investment opportunities, it makes sense that Interpublic Group of Companies has been paying out a decent 45% of its earnings to shareholders. Given the business isn't reinvesting in itself, it makes sense to distribute a portion of earnings among shareholders.
On a separate but related note, it's important to know that Interpublic Group of Companies has a current liabilities to total assets ratio of 54%, which we'd consider pretty high. This effectively means that suppliers (or short-term creditors) are funding a large portion of the business, so just be aware that this can introduce some elements of risk. Ideally we'd like to see this reduce as that would mean fewer obligations bearing risks.
The Key Takeaway
In a nutshell, Interpublic Group of Companies has been trudging along with the same returns from the same amount of capital over the last five years. Although the market must be expecting these trends to improve because the stock has gained 64% over the last five years. Ultimately, if the underlying trends persist, we wouldn't hold our breath on it being a multi-bagger going forward.
If you want to continue researching Interpublic Group of Companies, you might be interested to know about the 2 warning signs that our analysis has discovered.
While Interpublic Group of Companies may not currently earn the highest returns, we've compiled a list of companies that currently earn more than 25% return on equity. Check out this free list here.
Have feedback on this article? Concerned about the content? Get in touch with us directly. Alternatively, email editorial-team (at) simplywallst.com.
This article by Simply Wall St is general in nature. We provide commentary based on historical data and analyst forecasts only using an unbiased methodology and our articles are not intended to be financial advice. It does not constitute a recommendation to buy or sell any stock, and does not take account of your objectives, or your financial situation. We aim to bring you long-term focused analysis driven by fundamental data. Note that our analysis may not factor in the latest price-sensitive company announcements or qualitative material. Simply Wall St has no position in any stocks mentioned.
