
 Yahoo Finance
 Is International Business Machines Corporation's (NYSE:IBM) P/E Ratio Really That Good?

Today, we'll introduce the concept of the P/E ratio for those who are learning about investing. We'll apply a basic P/E ratio analysis to International Business Machines Corporation's (NYSE:IBM), to help you decide if the stock is worth further research. International Business Machines has a price to earnings ratio of 15.61, based on the last twelve months. That is equivalent to an earnings yield of about 6.4%.
See our latest analysis for International Business Machines
How Do You Calculate International Business Machines's P/E Ratio?
The formula for P/E is:
Price to Earnings Ratio = Price per Share ÷ Earnings per Share (EPS)
Or for International Business Machines:
P/E of 15.61 = $135.27 ÷ $8.67 (Based on the trailing twelve months to September 2019.)
Is A High P/E Ratio Good?
A higher P/E ratio means that buyers have to pay a higher price for each $1 the company has earned over the last year. That isn't necessarily good or bad, but a high P/E implies relatively high expectations of what a company can achieve in the future.
How Does International Business Machines's P/E Ratio Compare To Its Peers?
The P/E ratio essentially measures market expectations of a company. The image below shows that International Business Machines has a lower P/E than the average (31.0) P/E for companies in the it industry.
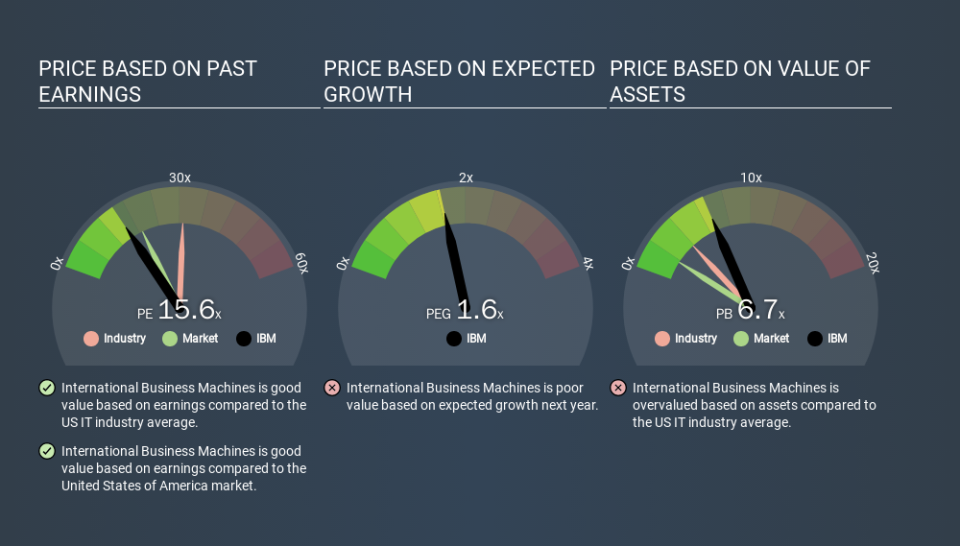
This suggests that market participants think International Business Machines will underperform other companies in its industry. While current expectations are low, the stock could be undervalued if the situation is better than the market assumes. If you consider the stock interesting, further research is recommended. For example, I often monitor director buying and selling.
How Growth Rates Impact P/E Ratios
When earnings fall, the 'E' decreases, over time. Therefore, even if you pay a low multiple of earnings now, that multiple will become higher in the future. So while a stock may look cheap based on past earnings, it could be expensive based on future earnings.
International Business Machines increased earnings per share by a whopping 39% last year. Unfortunately, earnings per share are down 12% a year, over 5 years.
A Limitation: P/E Ratios Ignore Debt and Cash In The Bank
One drawback of using a P/E ratio is that it considers market capitalization, but not the balance sheet. That means it doesn't take debt or cash into account. Hypothetically, a company could reduce its future P/E ratio by spending its cash (or taking on debt) to achieve higher earnings.
While growth expenditure doesn't always pay off, the point is that it is a good option to have; but one that the P/E ratio ignores.
So What Does International Business Machines's Balance Sheet Tell Us?
International Business Machines's net debt equates to 46% of its market capitalization. While it's worth keeping this in mind, it isn't a worry.
The Verdict On International Business Machines's P/E Ratio
International Business Machines has a P/E of 15.6. That's below the average in the US market, which is 18.9. The company does have a little debt, and EPS growth was good last year. If it continues to grow, then the current low P/E may prove to be unjustified. Since analysts are predicting growth will continue, one might expect to see a higher P/E so it may be worth looking closer.
When the market is wrong about a stock, it gives savvy investors an opportunity. If it is underestimating a company, investors can make money by buying and holding the shares until the market corrects itself. So this free visualization of the analyst consensus on future earnings could help you make the right decision about whether to buy, sell, or hold.
Of course you might be able to find a better stock than International Business Machines. So you may wish to see this free collection of other companies that have grown earnings strongly.
If you spot an error that warrants correction, please contact the editor at editorial-team@simplywallst.com. This article by Simply Wall St is general in nature. It does not constitute a recommendation to buy or sell any stock, and does not take account of your objectives, or your financial situation. Simply Wall St has no position in the stocks mentioned.
We aim to bring you long-term focused research analysis driven by fundamental data. Note that our analysis may not factor in the latest price-sensitive company announcements or qualitative material. Thank you for reading.
