
 Yahoo Finance
 Are Intermin Resources Ltd’s (ASX:IRC) Returns Worth Your While?

Today we'll evaluate Intermin Resources Ltd (ASX:IRC) to determine whether it could have potential as an investment idea. Specifically, we're going to calculate its Return On Capital Employed (ROCE), in the hopes of getting some insight into the business.
First, we'll go over how we calculate ROCE. Then we'll compare its ROCE to similar companies. And finally, we'll look at how its current liabilities are impacting its ROCE.
What is Return On Capital Employed (ROCE)?
ROCE measures the amount of pre-tax profits a company can generate from the capital employed in its business. All else being equal, a better business will have a higher ROCE. Overall, it is a valuable metric that has its flaws. Renowned investment researcher Michael Mauboussin has suggested that a high ROCE can indicate that 'one dollar invested in the company generates value of more than one dollar'.
So, How Do We Calculate ROCE?
Analysts use this formula to calculate return on capital employed:
Return on Capital Employed = Earnings Before Interest and Tax (EBIT) ÷ (Total Assets - Current Liabilities)
Or for Intermin Resources:
0.083 = AU$2.0m ÷ (AU$25m - AU$730k) (Based on the trailing twelve months to December 2018.)
Therefore, Intermin Resources has an ROCE of 8.3%.
See our latest analysis for Intermin Resources
Does Intermin Resources Have A Good ROCE?
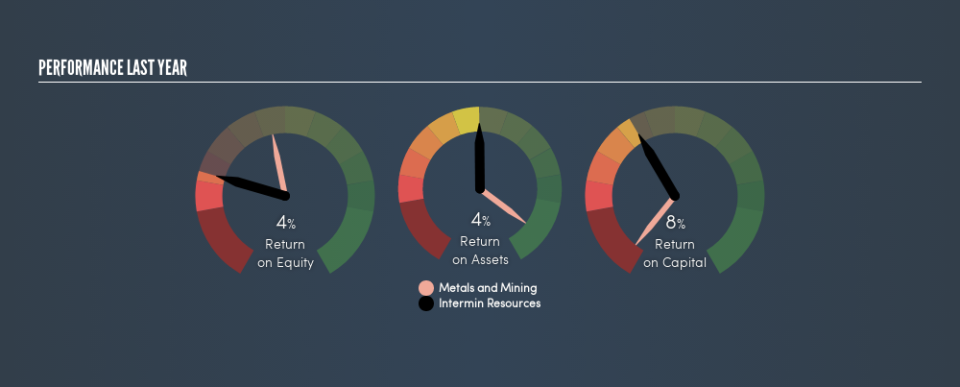
ROCE is commonly used for comparing the performance of similar businesses. Using our data, Intermin Resources's ROCE appears to be around the 9.5% average of the Metals and Mining industry. Setting aside the industry comparison for now, Intermin Resources's ROCE is mediocre in absolute terms, considering the risk of investing in stocks versus the safety of a bank account. Readers may find more attractive investment prospects elsewhere.
Intermin Resources reported an ROCE of 8.3% -- better than 3 years ago, when the company didn't make a profit. That implies the business has been improving. The image below shows how Intermin Resources's ROCE compares to its industry, and you can click it to see more detail on its past growth.
When considering this metric, keep in mind that it is backwards looking, and not necessarily predictive. ROCE can be misleading for companies in cyclical industries, with returns looking impressive during the boom times, but very weak during the busts. ROCE is only a point-in-time measure. We note Intermin Resources could be considered a cyclical business. How cyclical is Intermin Resources? You can see for yourself by looking at this free graph of past earnings, revenue and cash flow.
Do Intermin Resources's Current Liabilities Skew Its ROCE?
Liabilities, such as supplier bills and bank overdrafts, are referred to as current liabilities if they need to be paid within 12 months. The ROCE equation subtracts current liabilities from capital employed, so a company with a lot of current liabilities appears to have less capital employed, and a higher ROCE than otherwise. To counter this, investors can check if a company has high current liabilities relative to total assets.
Intermin Resources has total assets of AU$25m and current liabilities of AU$730k. As a result, its current liabilities are equal to approximately 2.9% of its total assets. Intermin Resources has a low level of current liabilities, which have a minimal impact on its uninspiring ROCE.
Our Take On Intermin Resources's ROCE
Intermin Resources looks like an ok business, but on this analysis it is not at the top of our buy list. You might be able to find a better investment than Intermin Resources. If you want a selection of possible winners, check out this free list of interesting companies that trade on a P/E below 20 (but have proven they can grow earnings).
I will like Intermin Resources better if I see some big insider buys. While we wait, check out this free list of growing companies with considerable, recent, insider buying.
We aim to bring you long-term focused research analysis driven by fundamental data. Note that our analysis may not factor in the latest price-sensitive company announcements or qualitative material.
If you spot an error that warrants correction, please contact the editor at editorial-team@simplywallst.com. This article by Simply Wall St is general in nature. It does not constitute a recommendation to buy or sell any stock, and does not take account of your objectives, or your financial situation. Simply Wall St has no position in the stocks mentioned. Thank you for reading.
